Announcing the results of the annual ECCE App Challenge
Join us in congratulating the winners of the ECCE App Challenge! Teams from the participating colleges and universities across Canada had one week to develop apps around this year’s theme of Urban Expansion.
The 10th annual Esri Canada GIS Centres of Excellence (ECCE) App Challenge has concluded, and the judges have selected the winners. A total of 26 teams participated between February and April. This year’s theme was inspired by the latest Statistics Canada numbers, which show that as of 2021 73.7% of Canadians live in one of our 41 large urban centres and that the downtowns of some cities, including Halifax, Montréal, and Calgary, and the suburbs of cities such as Edmonton, Calgary, and Ottawa have experienced a growth of over 20% since 2016. The increased density and sprawl caused by this urban growth can create or exacerbate issues that may affect everyone, issues such as lack accessibility of essential services, air pollution, and reduced mental health from lack of green space. Teams were therefore tasked with developing apps on the theme of Urban Expansion and allowed to choose any related topic. They rose to the challenge and we received many great submissions.
Students had one week from the time the theme was revealed to their team to develop an idea into a finished product. A variety of ArcGIS products were used, including ArcGIS Experience Builder, ArcGIS StoryMaps, ArcGIS Hub, and various ArcGIS Maps SDKs for custom development. While students had broad access to the ArcGIS suite of products, some limitations were introduced this year to try to counter the scope creep over the years. Each year, teams tend to look back at past winners and aim to do even better. While this has led to some amazing apps, it has also led to larger and larger submissions, well beyond the initial vision for the App Challenge. To bring the submissions back into the intended scope, and put more focus on quality rather than quantity, teams were not allowed to use ArcGIS StoryMap Collections. Pitch videos were also limited to 10 minutes, although a length of 5 minutes was very strongly recommended. Additional restrictions were put in place due to the ArcGIS API for JavaScript, Version 3.x retirement, mainly not allowing the use of ArcGIS Web AppBuilder, which is built on the 3.x API.
Judging Panel
There are two rounds of judging for the App Challenge. First, an internal round of judging by the Education and Research department selects the top 10 submissions. Then, a panel of judges reviews those top 10 and each judge selects their top 3 teams. The judges’ scores are combined to determine the winning team and 1st and 2nd runners-up. Before we get to the winners, I would like to thank our three judges. This year, the judges were Erin Morrow from Ratio.City, a division of Esri Canada; Mike Ballard from Kivista Solutions Inc.; and Phil Healy, from the City of Kingston.

Erin Morrow is an Ontario Registered Professional Planner (RPP) and US Certified Planner (AICP) with over 20 years of experience developing software products and leading projects that transform the built environment. Prior to joining Esri Canada, Erin was the co-founder of Ratio.City, which continues to provide industry-leading data and analysis tools for urban planners.

Mike Ballard has been a GIS enthusiast from the time he wrote his first AML script with ArcInfo 3. Mike has dabbled in web-based GIS for a couple of decades, and appreciates a well designed information product that helps people make informed decisions. Being an instructor at Algonquin College was a platform for sharing his enthusiasm -- and the occasional critical statement about Web Mercator. Now with Public Safety Canada, Mike is on a team preparing hazard, exposure, and risk data to help Canadians cope with climate change.

Phil Healey is a GIS Solutions Architect with a passion for understanding the interconnectedness of geographic data and its applications in solving real world problems. With a career spanning over three decades, Phil has become a leading advocate for leveraging GIS technology to enhance public services, improve urban planning, and foster sustainable development. Throughout his career, Phil has collaborated with numerous city councils, departments and provincial agencies to implement GIS solutions that address community needs. Phil is committed to GIS literacy and education, serving as the Eastern Section Manager for BeSpatial Ontario and as a municipal representative on buildingSmart Canada's Municipal Infrastructure Council and Esri Canada's Community Map of Canada Advisory Council, as well as being involved with other professional associations.
2024 App Challenge Results
And now for the podium! Starting with our 2nd Runners-up, we have Mac4DAEs -- David Figueroa, Alice Stubbs, and Eva Boomsma -- from McMaster University and their app Road2Home that aims to help with the decision making about where to live in Toronto based on various criteria. Then we have our 1st Runners-up, Code Monkeys -- Andrew Ding, Kevin Lu, and Franco Chen -- from the University of Waterloo. Their app, MetroBooming, uses 3D visualization to help viewers understand Vancouver’s zoning and development, with tools to compare various scenarios of development.
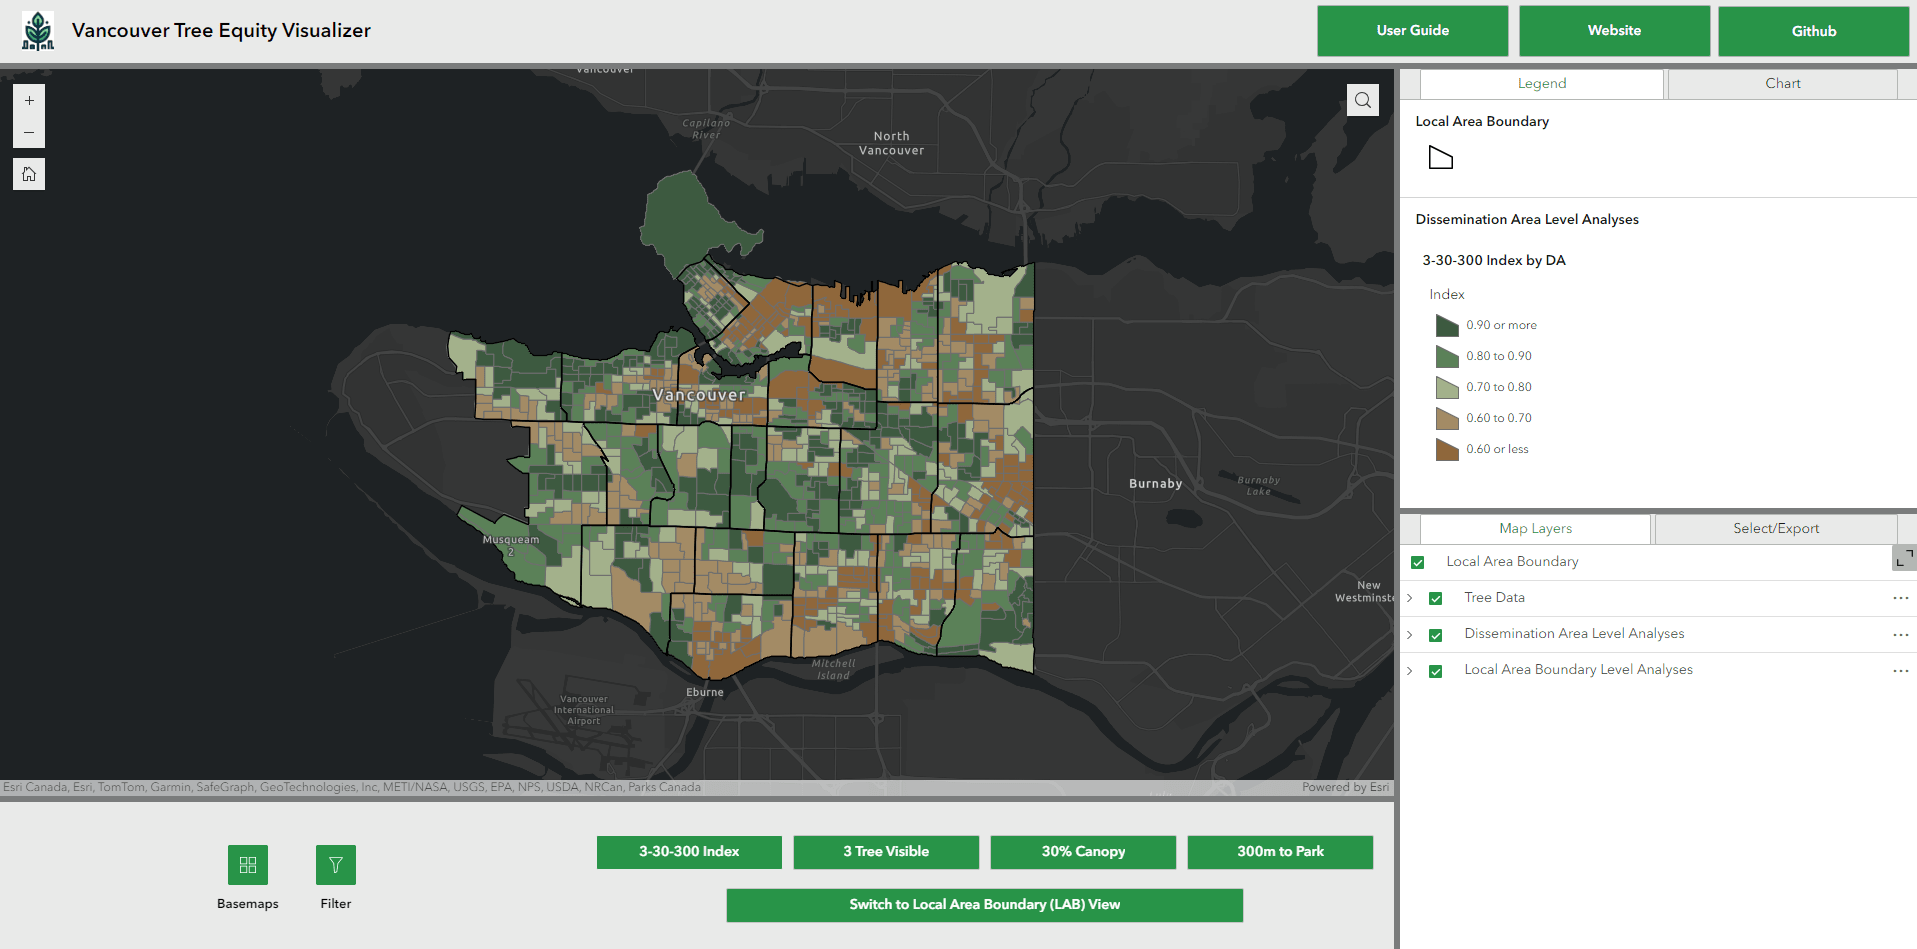
The winners of the ECCE App Challenge 2024 are BCITree -- David Choi, Jason Ellis, and Logan Salayka-Ladouceur. This is the second year in a row that a team from the British Columbia Institute of Technology has won. They created the Vancouver Tree Equity Visualizer, an app that aims to visualize and promote better tree equity by applying a 3-30-300 tree equity rule. This rule states that everyone should be able to observe at least 3 trees from their home, neighbourhoods should have at least 30% canopy cover, and everyone should live within 300 metres of at least one hectare of greenspace.

Congratulations to the winners and to all the participants! If you are a student at one of our ECCE institutions and you want to compete next year, reach out to the ECCE director at your institution. You may also want to speak to them about how you might become one of the ECCE Student Associates at your institution. The Student Associates are a group of particularly exceptional students involved in GIS research and/or development. They gain access to resources including instructor-led training from Esri Canada, personalized technical assistance from Esri Canada Education and Research staff, and other benefits to help them continue developing their skills and further their GIS research. To learn more about ECCE Student Associates and the ECCE program, visit ecce.esri.ca.