
On the Map with the Université Laval's Geography Department

Université Laval's Geography Department and Esri Canada's Education team co-hosted a mapmaking workshop at Collège de Champigny.

As part of activities surrounding the celebration of GIS Day, Université Laval's Geography Department organized an interactive mapmaking workshop with grade 7 students at the Collège de Champigny, located in the Sainte-Foy-Sillery-Cap-Rouge borough of Québec City. On October 17,  Karine Tessier, who was behind the project, visited Collège de Champigny accompanied by Albert Chalifoux, a Bachelor’s student in Geography.  The K-12 Education group was able to lend a hand by co-hosting the remote workshop.

The image contains two photos of portraits of people. The photo on the left takes up about two-thirds of the space. A woman with pale beige skin wears a plain gray short-sleeved sweater. She has a delicate chain around her neck and a pretty bracelet on her left wrist. Her chestnut hair, tending towards blond at the tips, is straight, tied up lightly in a half-ponytail and falls to her shoulders. The woman's gaze is frank, she looks directly at the camera and her expression is one of confidence. Behind the woman, there's a large green plant towering above her, like a snake plant. The space behind is an open, bright space where the materials seem to be concrete and light wood beams. The second photo on the right takes up a third of the space, is centred with the one on the left on the height and is slightly smaller. On a black square background, there's a portrait of a man framed at the shoulders in a circle. The man is wearing a long-sleeved dark gray shirt with a half-closed collar. Under his long-sleeved sweater, he wears another sweater in the same color with a round collar. The man's skin is light beige, and his well-groomed dark brown beard is long enough to show his neck between the end of his beard and the collars of his sweaters. The man is smiling. He is wearing simple eyeglasses with black metal frames. The man is bald. The man is posing against a background of shades of gray typical of a photo studio.

Karine Tessier, a teaching and research technician, and Albert Chalifoux, a Bachelor's student in Geography

Some 50 students took part in the event, under the guidance of Laurie Fortin and Kevin Trudel, who both teach social studies at Collège de Champigny. The mapmaking workshop, Montréal, a metropolis: Explore the infrastructure (in French), is the result of a superb collaboration between Université Laval's Geography Department, Esri Canada and teacher Laurie Fortin from Collège de Champigny. 

In a white rectangle with a slight transparency centered on the length of the image and located in the upper half of the image, the first two lines read "Montréal, une métropole : explorez les infrastructures" in bold black font, the second line reads "L'atelier de cartographie de l'Université Laval et d'Esri Canada" in a smaller, non-bold font and the third line reads "Esri Canada | Milieu scolaire et recherche" in an even smaller, bold font. The background image is an elevated view of the city. In the foreground are leafy treetops; in the background, up to halfway up the image, are multi-storey buildings, some of the skyscraper type typical of a dense urban center; in the distance, in the third plane, is a thin line that can be recognized as the St. Lawrence River, and a blue sky dotted with a variety of different types of light, white clouds. The photo was taken during the day.

The mapmaking workshop: Montréal, a metropolis: Explore the infrastructure (in French)

Laurie Fortin proposed the theme of the metropolis, which can be seen in the curriculumfor grade 7 under “Territoire urbain”. The teacher also provided the educational activity using Montréal, Québec's metropolis as a concrete context for the students. Karine Tessier of Université Laval enhanced the workshop by providing two feature layers, one containing the boundaries of the Montréal Metropolitan Community (MMC) and the other containing population density data from the 2021 census. I had the privilege of putting all this together in an ArcGIS StoryMaps story to support the workshop. It also included a short section giving students an introduction to the concept of geographic information systems (GIS).

Skills acquired by students

During the hour-long workshop, students developed a number of cartographic skills and explored various elements that characterize a metropolis. Students learned how to create data to map twelve typical locations found in a metropolis. The data were created as a feature layer. This makes it possible to document the mapped elements by offering the possibility of changing the symbology for each element, customizing the legend display, using filters or performing analyses on the attributes. Addressing the creation of data as feature layers provides an opportunity to discuss how data is collected, organized and interacted with. 

To map the various locations, the students used a visual analysis of satellite imagery and the Map Viewer search tool. The students then chose the appropriate symbols for each element and organized their legend. They also explored population density data and visually represented it using style options adapted to digital data visualization.

The image features a white band on the left, forming one-fifth of the total width, with a legend. Line by line, there are: 1st line, "Légende" followed by a space and then an X in the upper right-hand corner of the white band; 2nd line, there's a thin grey dividing line, 3rd line, "Lieux ou infrastructures"; 4th line, a round icon of a white plane on a grey background and "Aéroport international Pierre-Elliot Trudeau"; 5th line, a round icon of a white ship's ink on a blue background and "Port de Montréal"; 6th line, a round icon of a white subway car front on a gray background and "Station de métro Berri-UQAM"; 7th line, a round icon of a white bridge on a grey background and "Pont Samuel-De-Champlain"; 8th line; a round icon of two white buildings on a yellow background and "Centre-ville"; 9th line, an icon of blue buildings and "Secteur industriel de la Pointe-de-l'Île"; 10th line, a blue house and "Quartier résidentiel (Dollard-des-Ormeaux)"; 11th line, a round icon of a white fir tree on a green background and "Parc du Mont-Royal"; 12th line, a round icon of a white castle on a mauve background and "Château Dufresne"; 13th line, a round icon of a white building on a mauve background and "Université McGill"; 14th line, a round icon of a white building on a blue background and "Hôtel de Ville"; 15th line, a round icon of two white theater masks on a yellow background and "Place des festivals"; 16th line, there is a thin grey separating line; 17th and 18th lines, it says "Communauté métropolitaine de Montréal (CMM)"; 19th line, there's a polygon with a white interior and pale grey outline; 20th line, there's a thin grey dividing line; 21st line, it says "Densité de la population (2021)"; 22nd line, it says "Population_2021"; and the 23rd line, there's a narrow rectangle taking up about an eighth of the height of the image, showing a gradient of color going from top to bottom from white, to orange, to red, to mauve, ending at the bottom in indigo. At the very top of the rectangle, there's an arrow symbol and it says "Élevé". There's the same thing at the bottom, but it says "Faible" instead. The section forming four-fifths of the image features a geographical map. On a background of aerial imagery featuring roads, green vegetation and farmland rectangles, a polygon with a light grey outline is centered. Inside, from left to right and top to bottom, it reads: Parc National D’Oka, Sainte-Thérèse, Boisbriand, Beaconsfield, Beauharnois, Laval, Saint-Laurent, Terrebonne, Montréal, Sainte-Catherine, Longueuil, Brossard, Repentigny, Varennes, Saint-Bruno-de-Montarville. Near the transparent entry "Montréal", the color is white, then changes to orange, red, mauve, indigo and fading. On the periphery, several transparent islets gradually turn from reddish-mauve to indigo. Near "Montréal", there's a cluster of round icons.

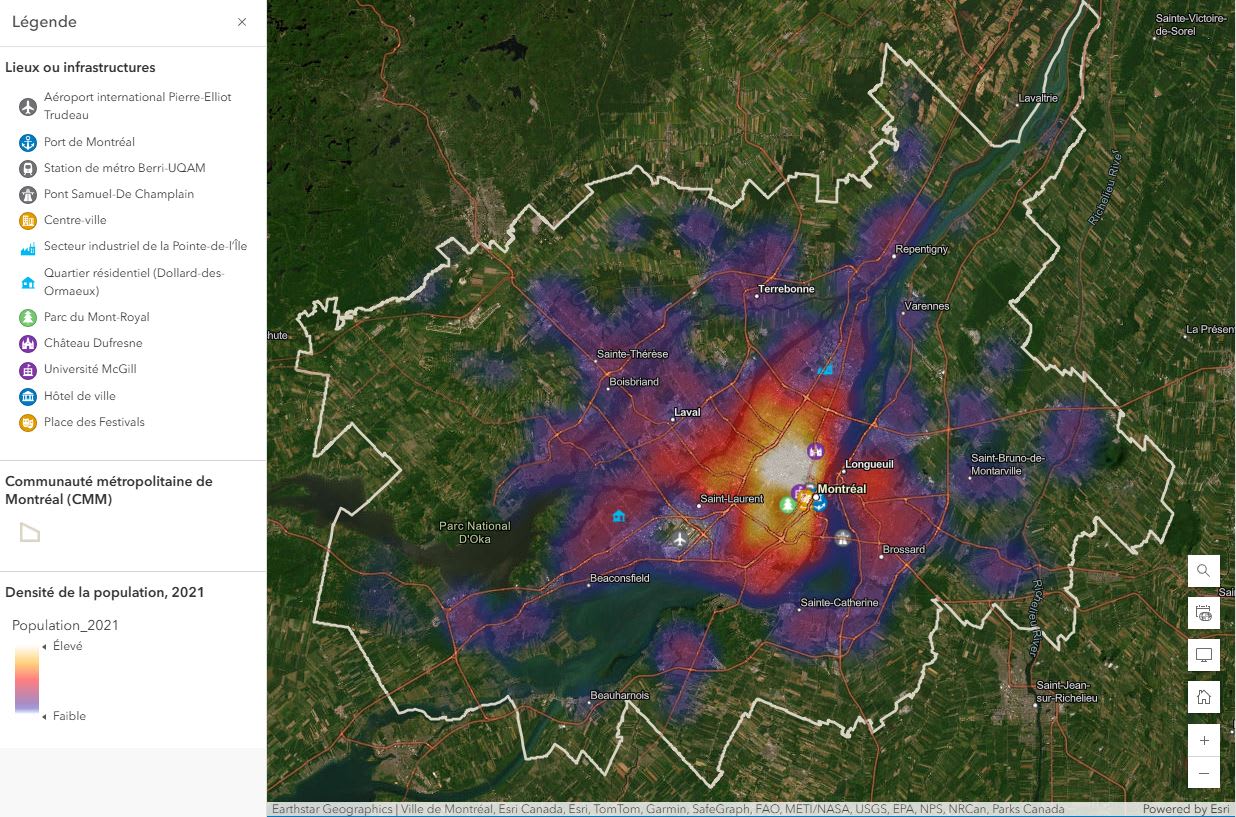
An example of a map the students had to produce

Needless to say, the one-hour workshop was the kick-off to the project, and the students continued to work on their mapmaking project afterwards.

Your toolbox

We are always available to answer your questions, and to guide and support you with your projects. Write to us at k12@esri.ca.

If you’d like to get started on your GIS adventure, visit our website to obtain free access for you and your students: k12.esri.ca.

For more activity ideas and a wide range of resources, visit our K12 Resource Finder.

This post was written in French by Arabelle Sauvé can be viewed here.