Pipelines and Parks: Integrating amenity data to create a park index
GIS users are often excited to share their results, but perhaps less excited to do the data preparation and integration work that is fundamental to the overall research process. ArcGIS Data Pipelines is a (relatively) new cloud-based data integration and data engineering application that can assist with those tasks. I tried using Data Pipelines to see if it could help save time and effort in integrating and maintaining data for a parks assessment project.
From students and educators to seasoned industry professionals, those of us in the GIS community like to share our work: the real-world problem we’re trying to solve, the analyses we’ve run, and the results we found - all wrapped up in a pretty map or web application. Much less talked about is the data prep side of things. Less exciting or flashy, and sometimes taking days or even weeks to complete and maintain, data preparation is nonetheless a key stage of the research process.
Data Pipelines is an easy-to-use no-code data integration and data engineering application that ingests and combines data from multiple sources and writes the output to a hosted feature layer or table in ArcGIS Online. It allows users to load, clean, combine, format, and maintain data from various sources and formats, including popular cloud storage services and data warehouses. It can be a great tool for students and researchers whose work requires integration of private or university-owned datasets in cloud databases, or when the source data is updated regularly and the output needs to be kept current.
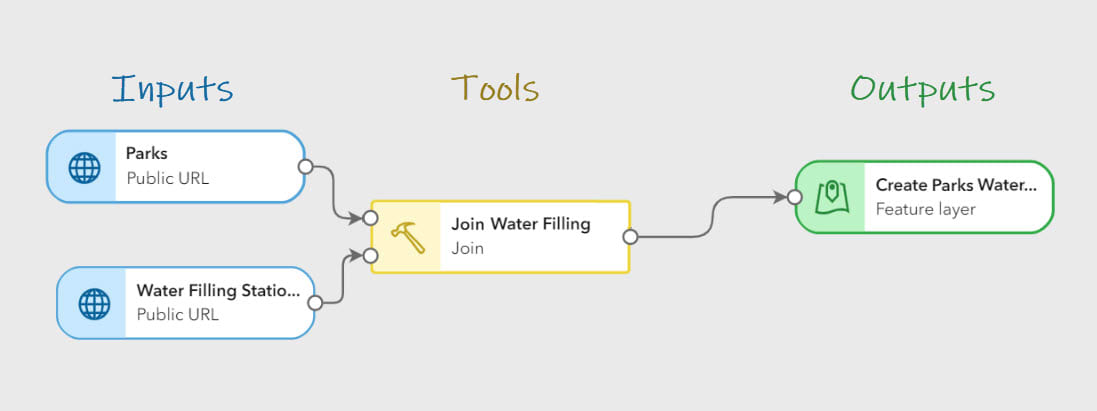
Pipeline elements are added to the canvas from the Inputs, Tools, or Outputs sections of the editor toolbar and connected together by specifying an input parameter or dragging and dropping connector lines between elements.
Parks Assessment Project
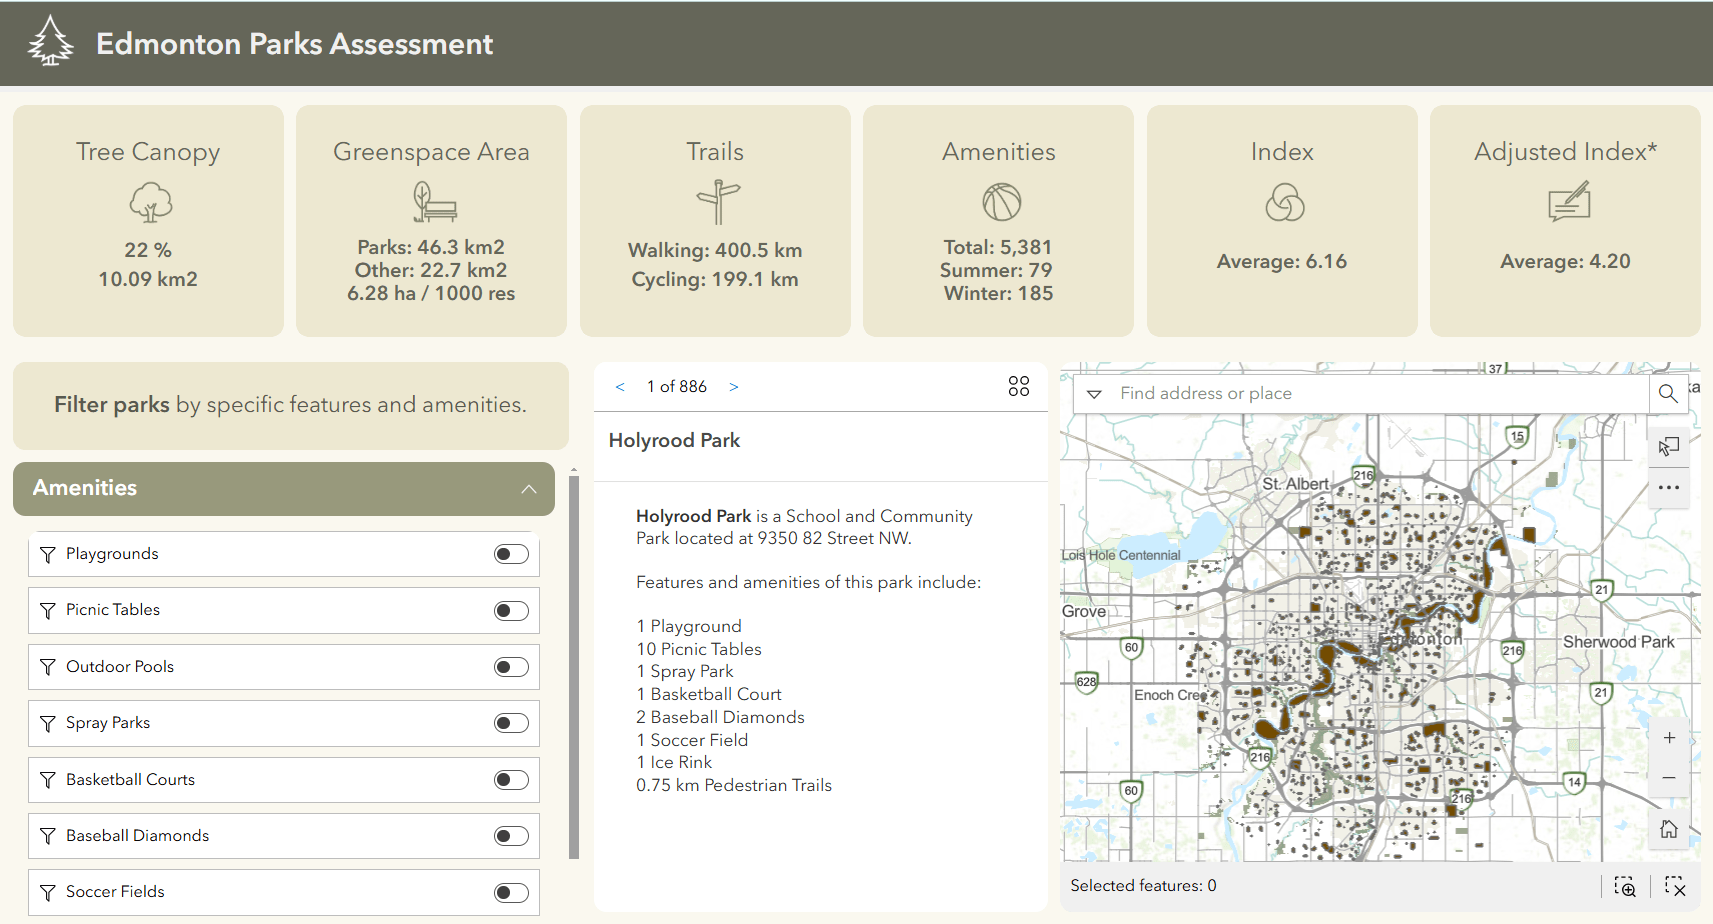
To better understand what Data Pipelines can do and how it can be used, let’s take a look at an example! I’m working on a landscape architecture project that involves creating a web app that summarizes key attributes and amenities available in Edmonton’s parks, to help assess park quality. The data will be used in tandem with survey responses from active park users to calculate an overall park quality index based on relevant variables, as per the diagram below.
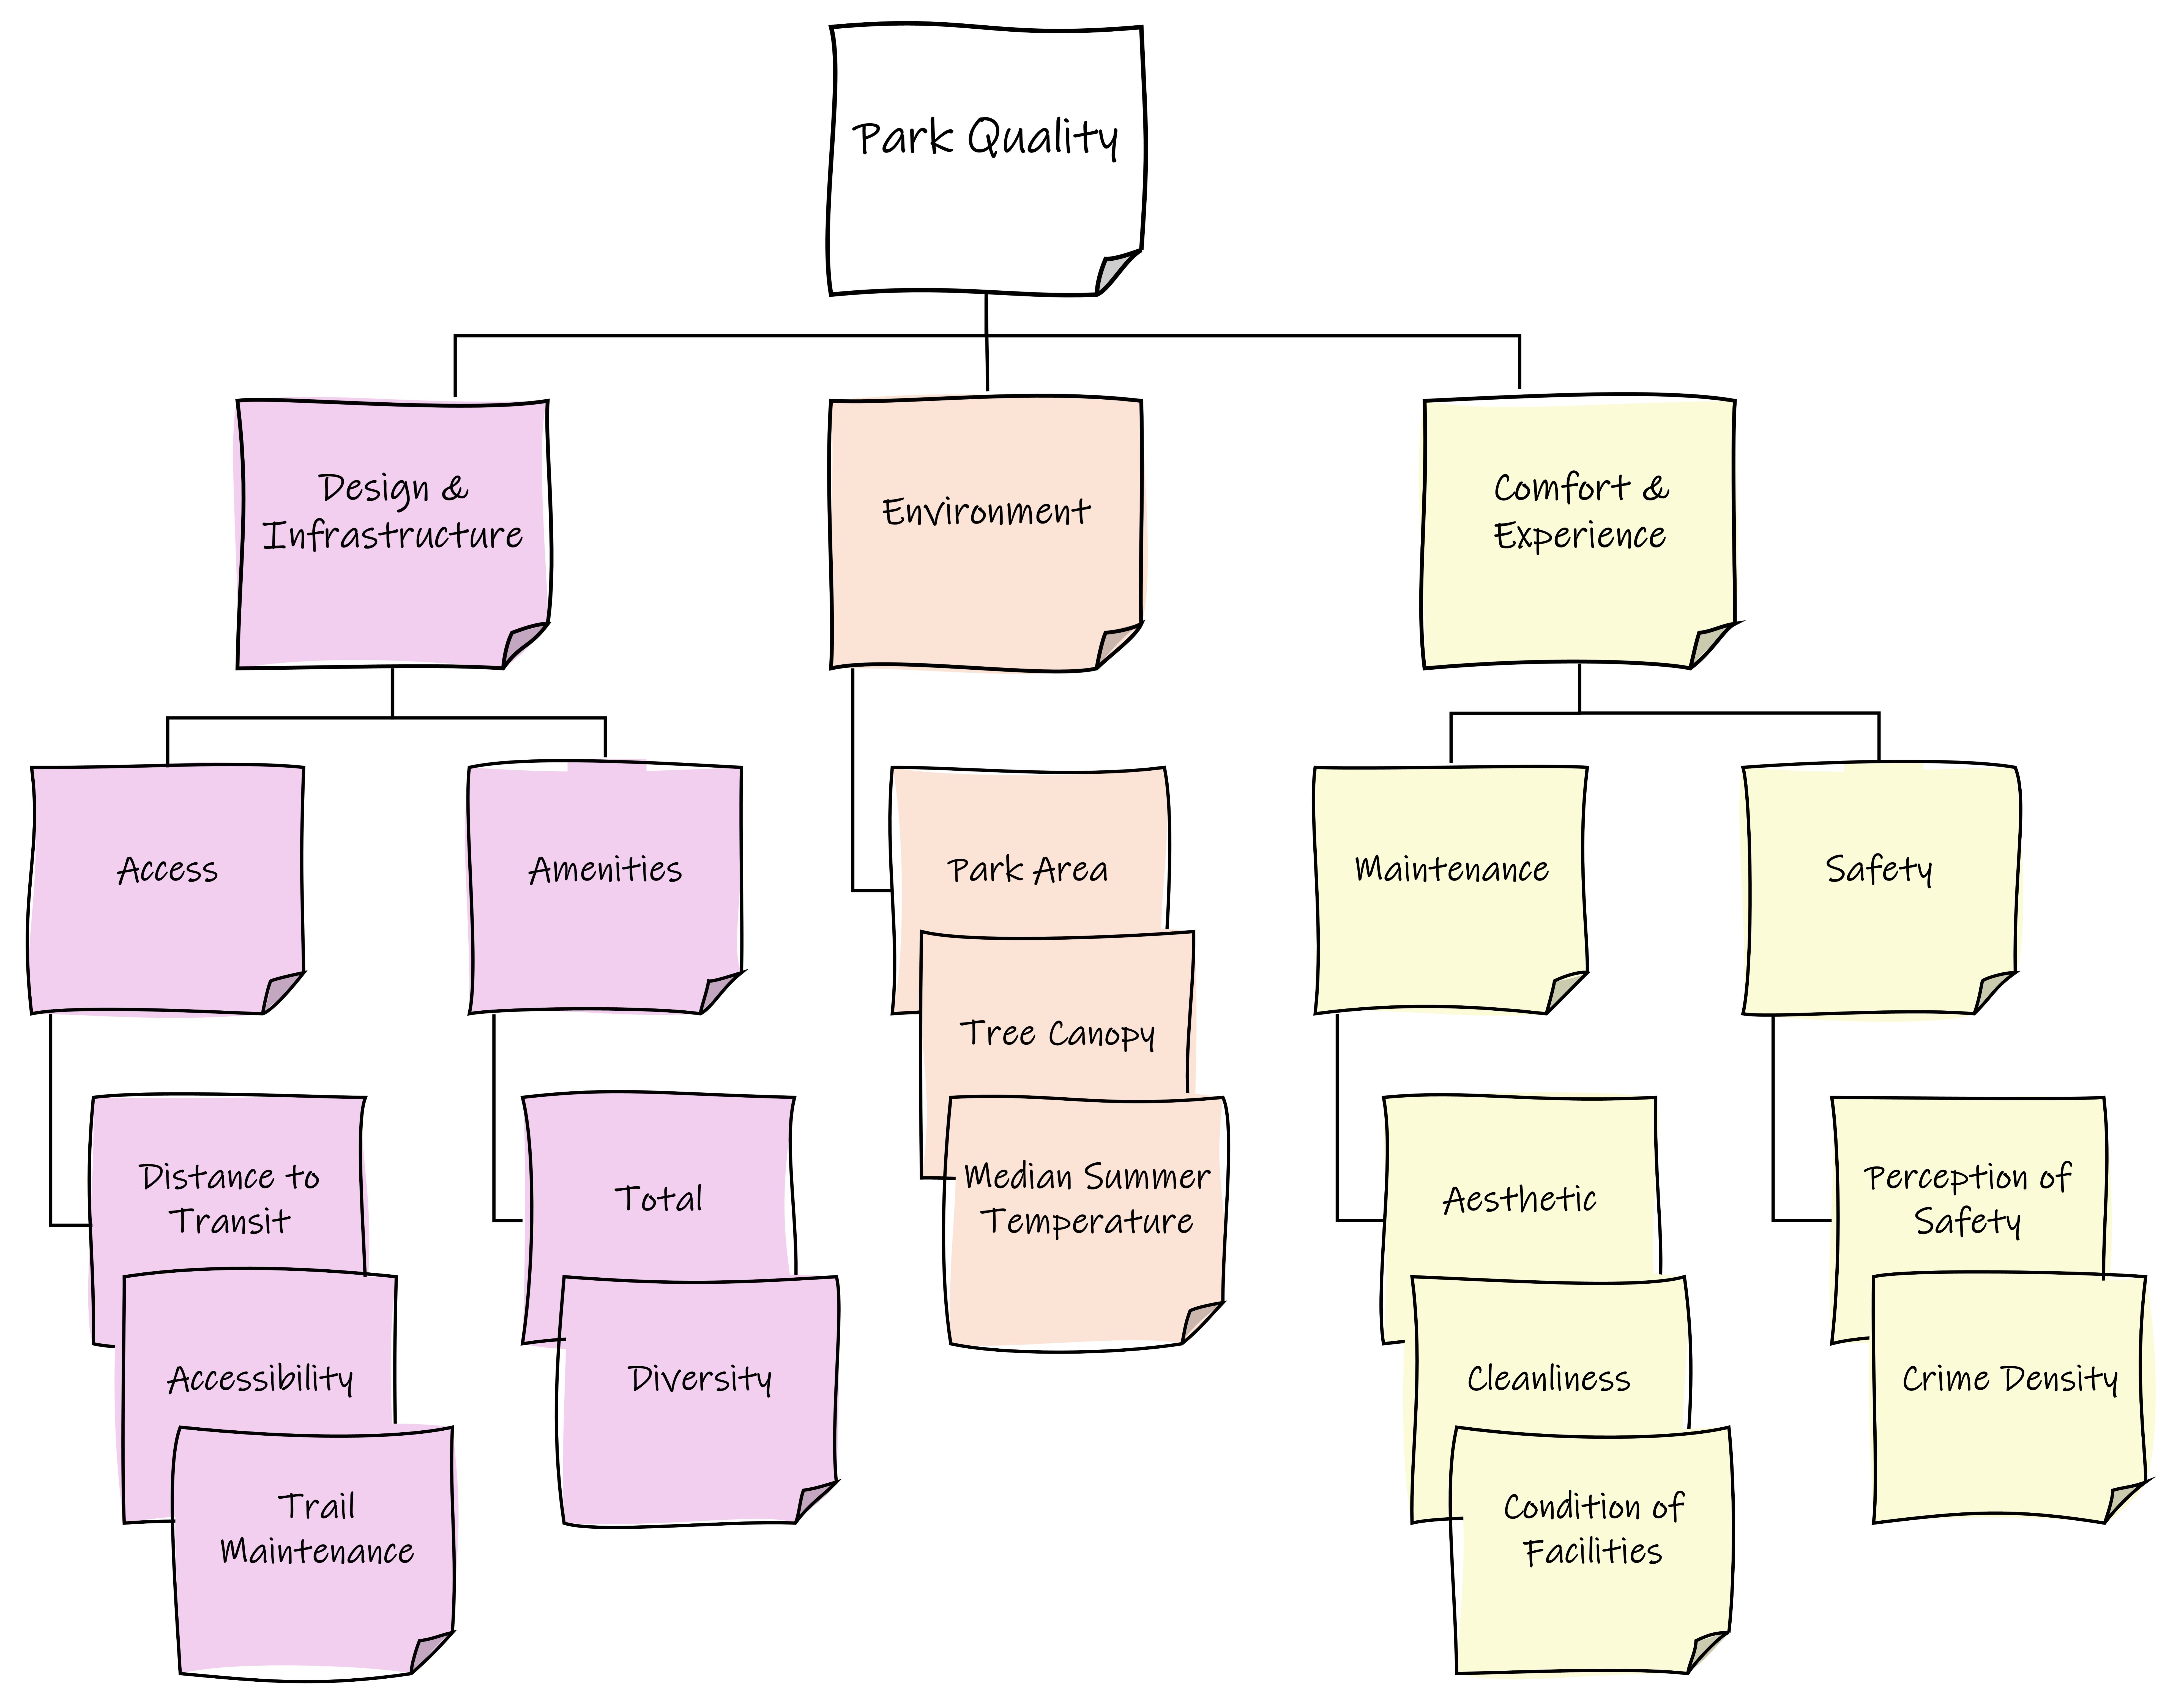
Variables and overarching dimensions used to calculate the park quality index.
The amenities I’m interested in tabulating are not in ArcGIS Online but can be found in the City of Edmonton’s open data portal as separate point layers or csv files. These need to be joined to the park polygon boundaries to summarize the number and type of amenities found within each park. I also want to calculate and summarize other features of the park, like the percent tree canopy cover and length of trails available.
Adding Inputs
While I could perform the joins and other data preparation in ArcGIS Pro, I would need to manually download and extract the files to my computer every time I wanted to update the data. Using Data Pipelines, I can import (and filter!) the most recent data directly from the source using-the-API endpoint. Datasets are added to Pipelines from the Inputs panel, which lists various data source types that can be used.

When adding data via an API endpoint, the data can be filtered for specific values by adding a URL parameter. This saves an extra step of filtering by attribute within Pipelines.
Creating the Workflow
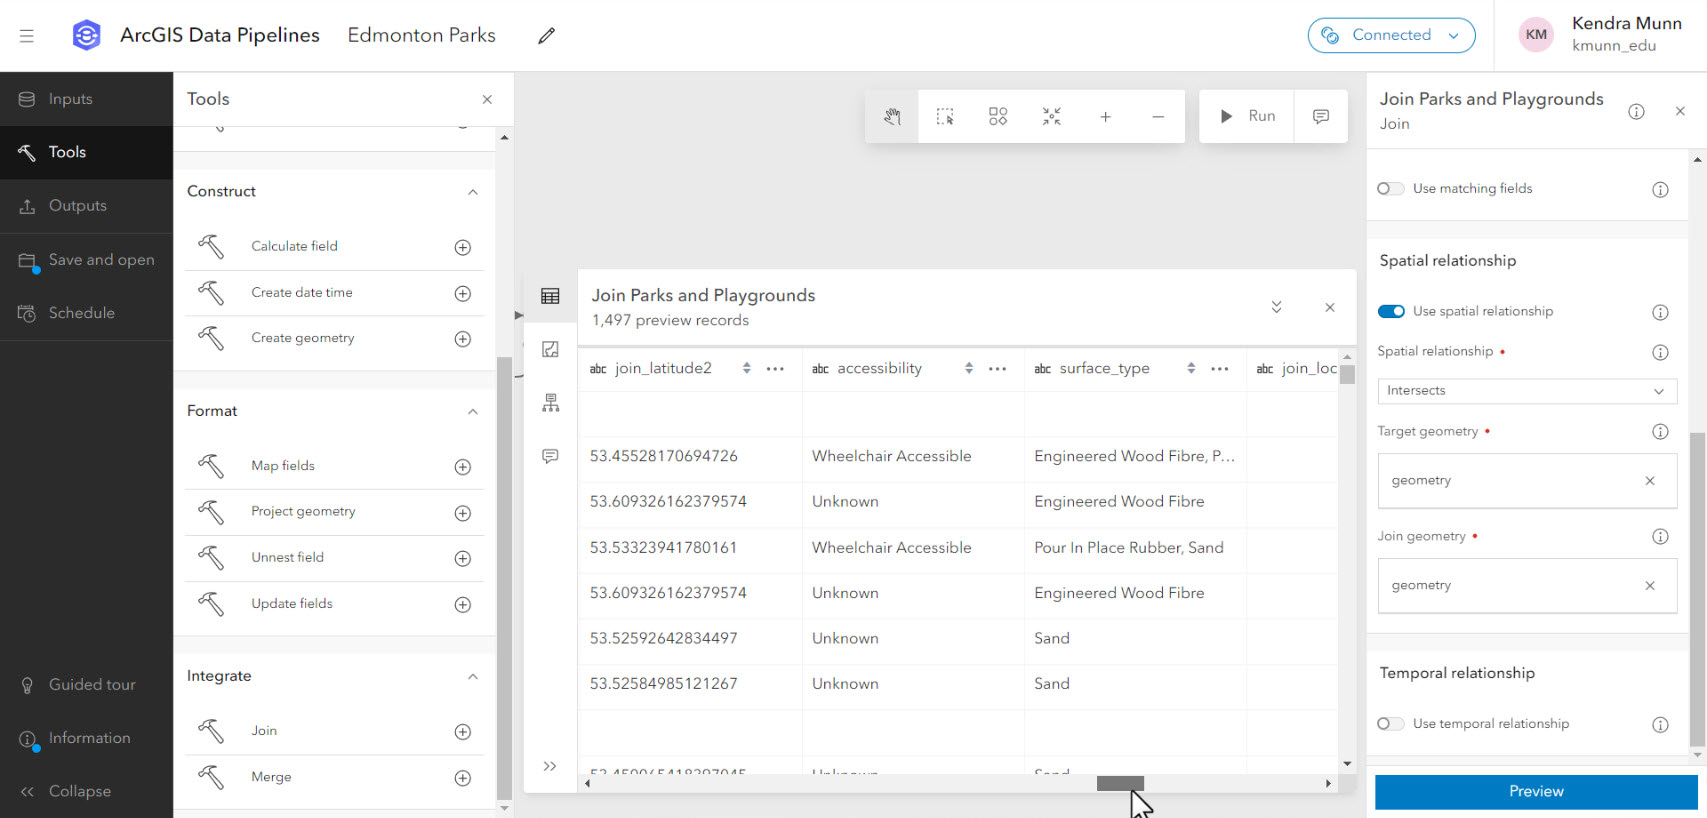
The bulk of the workflow was setting up processing tools in Data Pipelines, which are accessed from the Tools panel. Each of the point amenity inputs were joined spatially; a feature table containing information on separately analyzed park features was joined by attribute. I also used the Create Geometry tool to create points from coordinate fields in a CSV file.
Incorporating Survey Results
A survey form was created in ArcGIS Survey123 to collect feedback on various aspects of park quality and experience from active park users. Keeping with the theme of minimizing time and effort, I created a first draft using the AI assistant in beta. Using natural language prompts, the assistant generates and subsequently revises a draft survey, which can then be tweaked and finalized in the regular web editor.
Once a few initial submissions were received, I could add the survey results layer to the data pipeline. I polished the schema using the Update Field tool to rename the spatial join count fields and change them from big integer to short type fields to use the data later in ArcGIS Experience Builder. I also used Arcade expressions in the Calculate Field tool to convert string survey responses to numeric variable scores before writing the final output to a feature layer in ArcGIS Online.

Arcade expressions can be used to calculate field values.
Troubleshooting, Refinement and Sharing the Results
After roughly an hour and a half, I had configured my first data pipeline! However, the complex park polygon geometry and large number of spatial joins caused performance issues, triggering error notifications that all outputs had failed. The issue was resolved by disabling input dataset caching and reconfiguring the pipeline to use staggered intermediate output layers, as below:
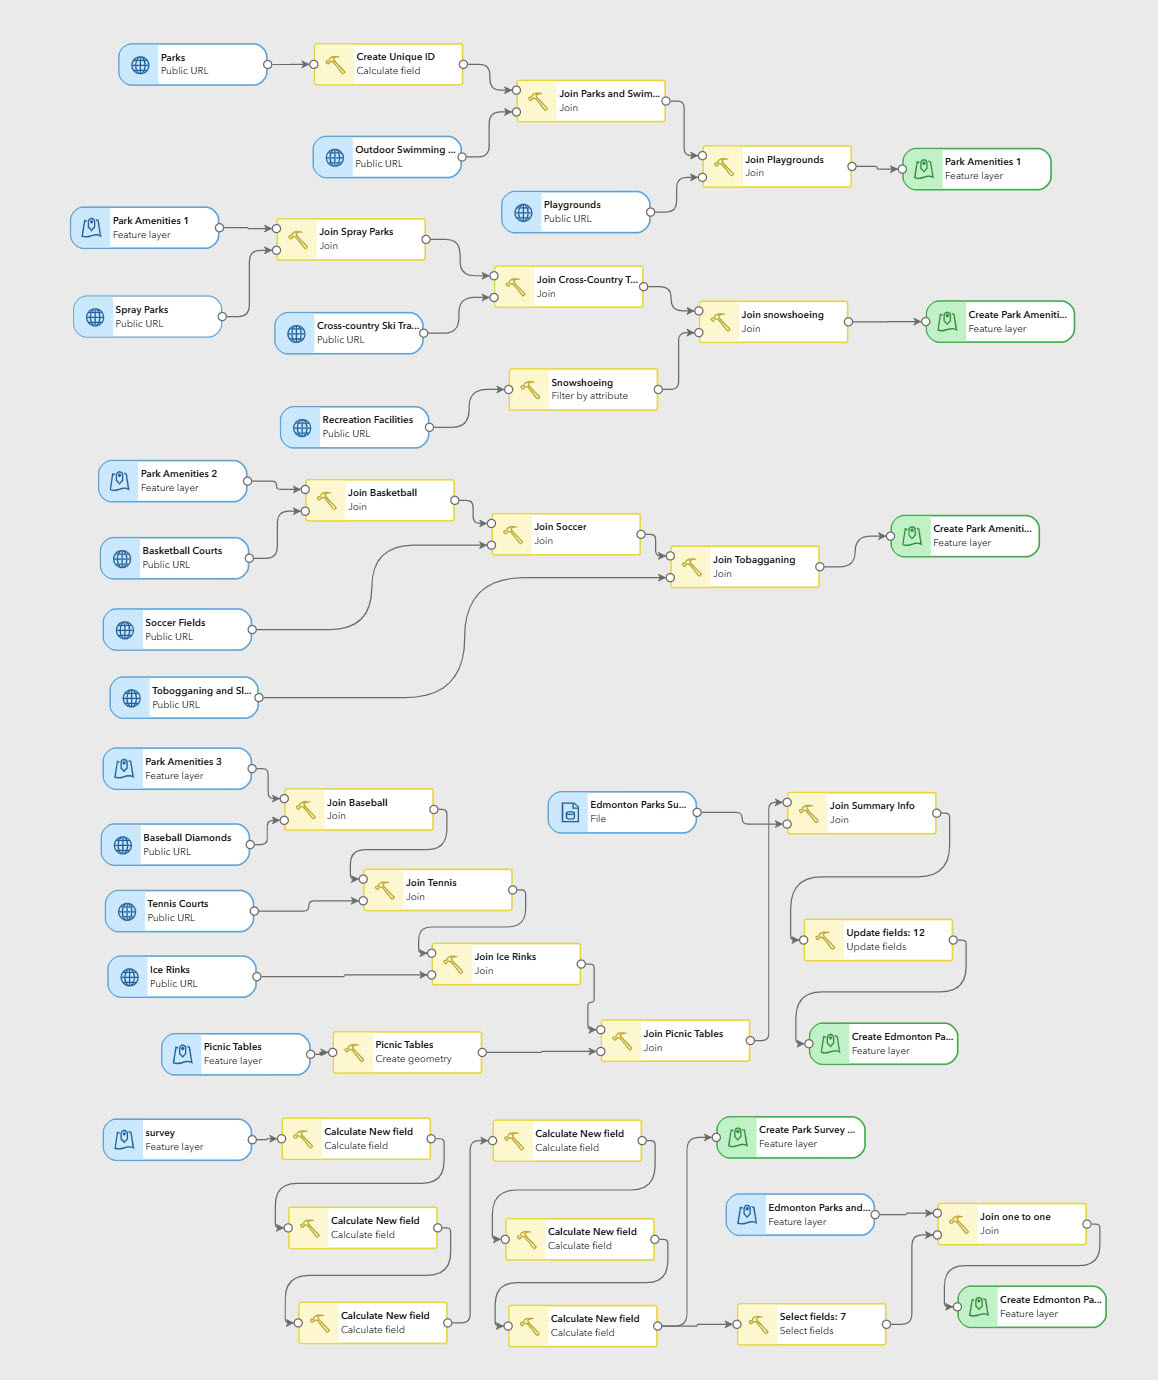
My final data pipeline, rearranged to display the entire workflow.
While Data Pipelines is useful for data integration workflows, it wasn't designed for analysis and is only able to work with vector data. Thus, raster and summary analyses for percent tree canopy cover and trail length were performed in ArcGIS Pro. The index was also calculated in ArcGIS Pro. As of the latest update, ModelBuilder is now available in ArcGIS Online, in beta, so this could be an alternative option for those who want to keep their workflows entirely online.-
The modified layer was added to a web app designed to help users assess and compare the amenities and overall quality of local parks.
One of the main benefits of Data Pipelines is the ability to schedule automated runs to ensure that your data are kept up-to-date and maintained over time. As I don’t anticipate parks and their amenities changing frequently, I scheduled the base pipeline to run every three months. I didn’t schedule the survey integration pipeline, as this can be done manually from the pipelines gallery page after receiving a number of new responses. In any case, pipelines that will be rerun should modify the output layer settings to replace or overwrite the original layer.
Lessons Learned
My conclusion? Depending on the nature of your project, Data Pipelines can definitely be useful for automating data integration workflows! However, to ensure better outcomes and reduce the stress of editing under the clock, I would make the following recommendations to new users:
- Be mindful of credits! Credit consumption is time-based and calculated per minute when a scheduled task is running, or while you are in the editor (with a 10-minute minimum), even if you are not actively editing the pipeline. The editor automatically disconnects after a period of inactivity, but it is still good practice to disconnect as soon as you are done. Depending on your workflow, you may want to reach out to your university’s ArcGIS Online administrator to ensure you have enough credits to configure and run your pipeline.
- Try to plan out the general steps of your workflow prior to opening an editor session to minimize credit consumption.
- Any field calculations you make will have to be in Arcade, so it is worth brushing up on this first before jumping straight in. Note that you access values using $record.field_name, rather than $feature.field_name; see documentation.
- Preview is your friend! Using the Preview window on configured tools and outputs can warn you of any issues preventing your pipeline from running successfully, saving you time and credits.
- If you do receive error messages regarding disk space, try disabling input dataset caching and breaking up the workflow with intermediate output layers that you can bring back in as inputs. If it doesn’t affect your workflow, you can also try simplifying complex features.
So, should you use Data Pipelines for your research project?
Data Pipelines could be a great tool for you to use if:
- You need to integrate data from a variety of sources, including external web sources such as open data catalogues.
- You want to confine your workflows to ArcGIS Online.
- You want your output dataset to be used in the ArcGIS system, and not written back to your external cloud storage and databases.
- You need to ingest data that is updated regularly, e.g. a city’s data from a public URL that is updated monthly.
- You are not familiar or comfortable with Python scripting.
When you may want to consider using other tools:
- If you are working with a very large dataset, particularly complex polygon features.
- If you need to work with livestreamed real-time data, or big data processing – try ArcGIS Velocity.
- If you need to automate analysis workflows, or you’re limited in credits – try using ModelBuilder in ArcGIS Pro or Python.
- If you want to write results back to the source, or robust ETL tools for enhanced data cleaning and transformation that support a larger variety of file types – try Data Interoperability.
For more information, you can review Esri’s Introduction to ArcGIS Data Pipelines webinar and follow-up blog post, or read the documentation.