Building trust via digital storytelling: Fraser Valley Regional District
The Fraser Valley Regional District (FVRD), a federation of municipalities in southern British Columbia, wanted a better way of communicating complex planning and growth concepts to its residents. Rather than relying solely on long, chaptered PDF reports, the FVRD’s planning team has added a new digital storytelling tool to its roster. Now, information about the FVRD’s Regional Growth Strategy (RGS) is accessible to a wider audience thanks to vivid visuals and interactive maps.
In the wake of extreme weather events and high growth rates, regional district builds trust with residents
The Fraser Valley Regional District (FVRD), situated to the immediate east of the Metro Vancouver region in British Columbia, Canada, is a fast-growing federation of municipalities working together to achieve common goals. The FVRD encompasses eight unincorporated Electoral Areas as well as the municipalities of Abbotsford, Chilliwack, Mission, Kent, Hope and Harrison Hot Springs and provides shared services to nearly 365,000 residents.
Because of its proximity to Metro Vancouver, the FVRD has been experiencing significant population growth for decades. It manages this growth according to its Regional Growth Strategy (RGS), which it has been managing since 2004.
Every year, the RD produces a detailed RGS Monitoring Report to keep the public apprised of the progress being made on 33 indicators organized under eight strategic areas. These areas include Economic Strength & Resiliency, Transportation & Mobility, Climate Change and more, and encompass issues of understandable interest to anyone living in area communities, such as housing affordability, increasing traffic volumes and extreme weather events.
“In 2021, we experienced some extreme weather events. Metro Vancouver and the Lower Mainland were cut off from the rest of Canada due to major flooding and landslides in the eastern part of the valley. So people really want to understand how we’re doing as a region to mitigate and adapt to climate related events like this,” says Riley Smith, a planner with the FVRD.
But traditional methods of communicating the RGS, specifically static PDFs, are less effective at engaging community members. These lengthy documents, often exceeding 50 pages, frequently include tables, graphs and detailed descriptions that make for a challenging reading experience. The technical nature of the documents makes them less accessible to members of the public who want to learn about these topics, but don’t have the time or expertise to understand sometimes complex planning concepts and visualizations of the potential impacts of growth on their neighborhoods.
The FVRD recognized the need for a more engaging and accessible approach to communication that could foster better understanding and participation from the public.
An easy-to-use digital storytelling tool opens up engagement possibilities
To address these challenges, the FVRD began exploring innovative communication tools—ones that could help make the detailed information in the RGS Monitoring Report a little more engaging.
After researching various options, they found ArcGIS StoryMaps, a powerful digital storytelling tool that lets users combine maps, text and multimedia content to create immersive narrative experiences. ArcGIS StoryMaps stories can be shared to social media and embedded in websites. They’re also responsive and adaptable to mobile devices.
The FVRD team recognized that StoryMaps could help them effectively convey information from the RGS Monitoring Report by giving them a way to place visual elements alongside relevant, informative text within a sleek, easy-to-use interface.
StoryMaps also has the advantage, the FVRD team found, of being easy to use by their own staff. Members of the planning team who lack a GIS background are still able to create and update StoryMaps stories that they can share, which was especially important given the small size of FVRD’s team.
StoryMaps was also part of FVRD’s existing ArcGIS user types, meaning no additional cost to the FVRD team—and the ability to get more out of their investment.
“The FVRD’s top priority is fiscal responsibility,” said Patricia Ross, FVRD board chair. “The commitment of the Board and FVRD staff to being efficient and maximizing taxpayer dollars is showcased by using existing technology in an innovative way to engage with communities.”
Vivid visuals bring complex regional planning concepts to life
With ArcGIS StoryMaps in hand, the FVRD developed one story for every one of the focus areas tackled in the RGS and Monitoring Report—a total of eight detailed, vividly illustrated stories, as well as an introduction—which were then all grouped together within a StoryMaps collection.
Each StoryMaps story visually and interactively showcases the progress the FVRD has made to date on the RGS indicators. Each story in the collection focuses on a different priority area, making it easy for residents of FVRD—as well as businesses looking to set up shop in the area—to find what they’re looking for.
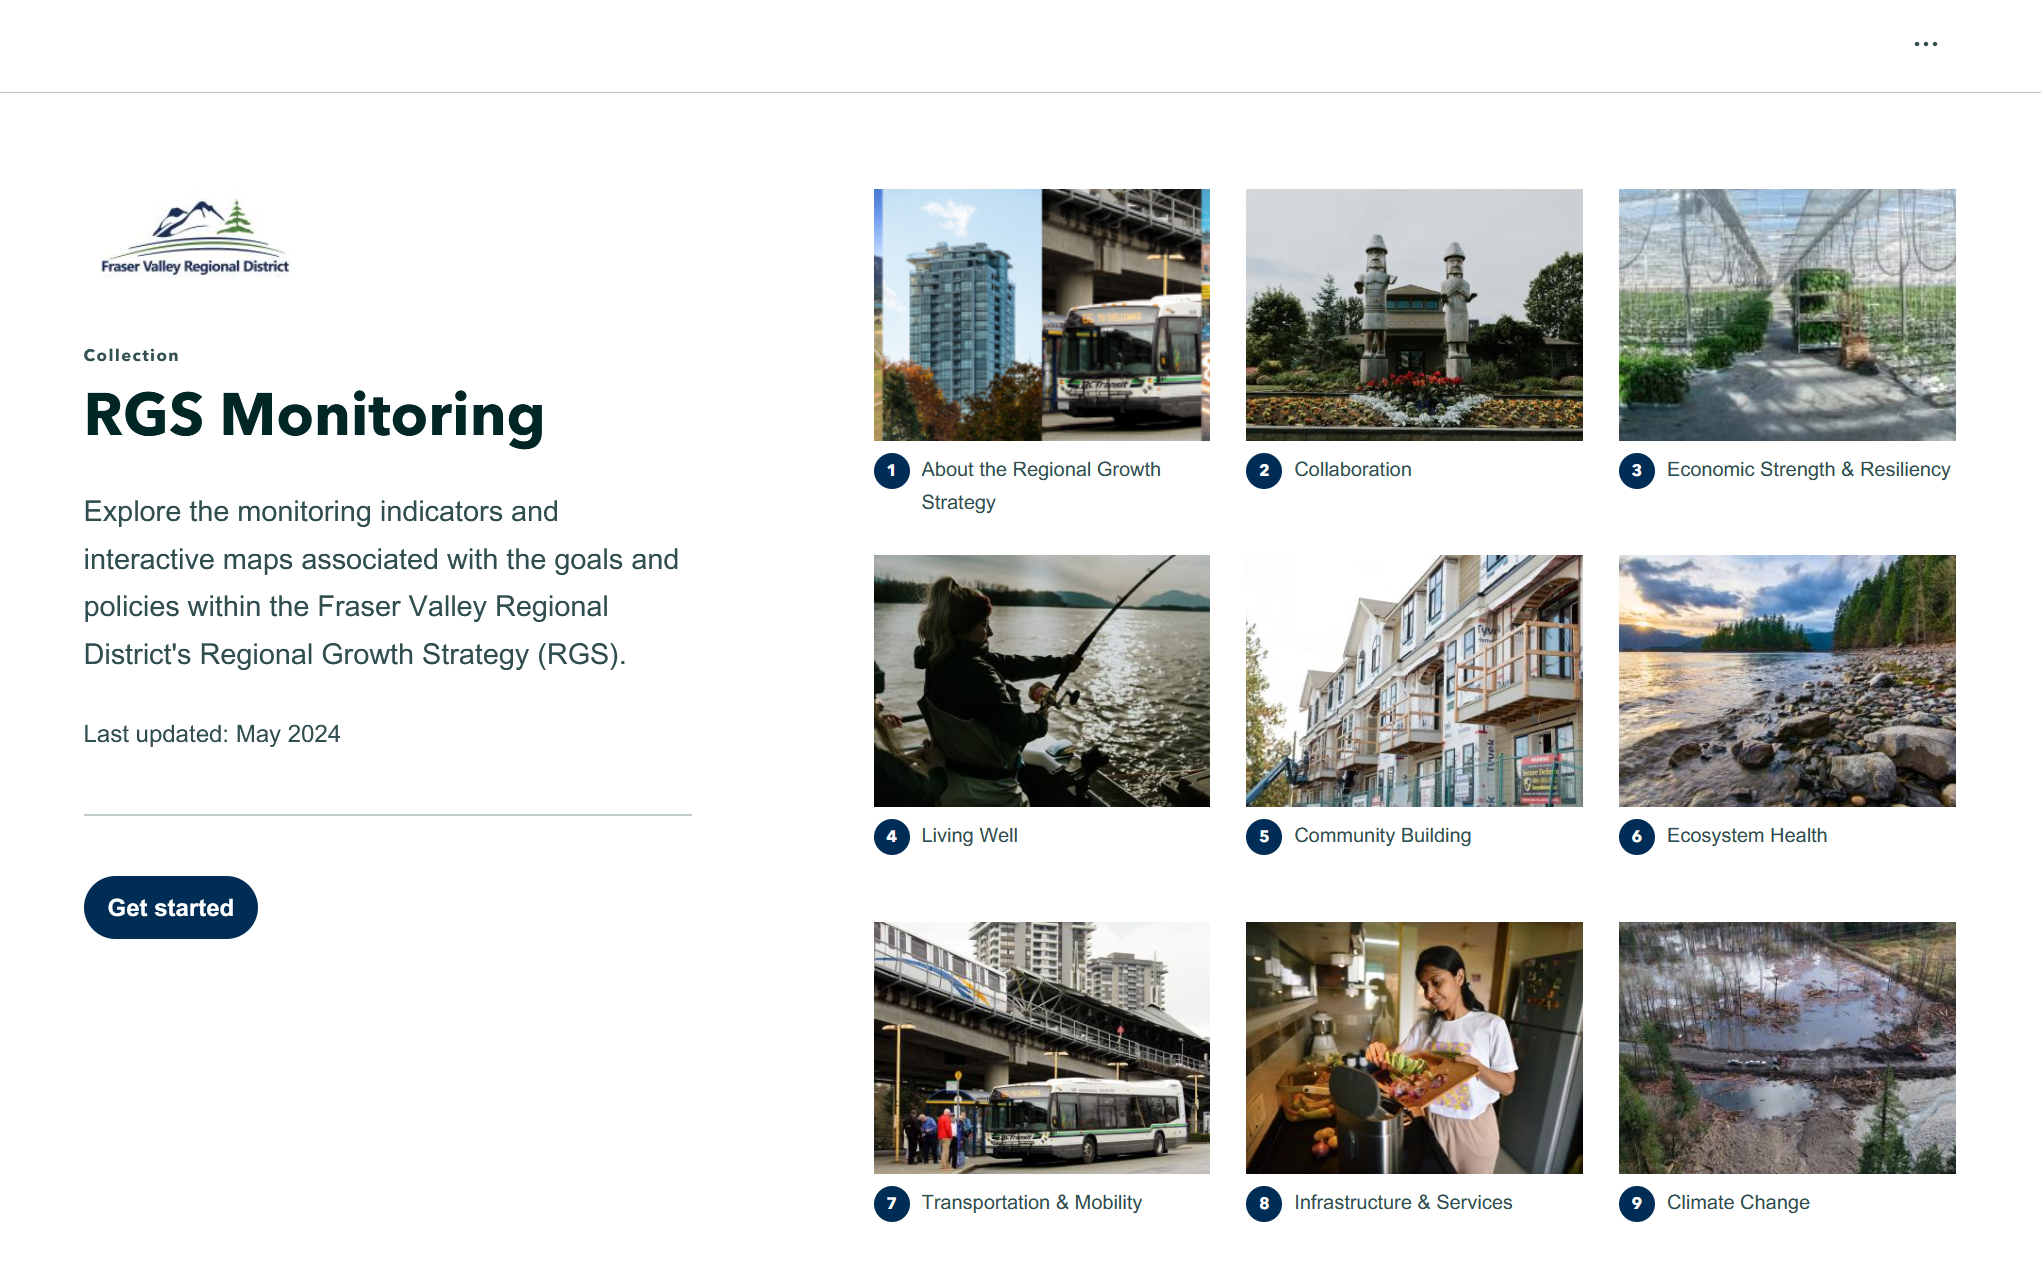
The FVRD’s RGS Monitoring collection showcases all the subsections of its growth strategy monitoring report in one convenient gallery.
Each story in the collection, themed with custom colors to match FVRD’s branding, uses StoryMaps tools to present graphs, charts and relevant statistics alongside interactive maps and beautiful photography. Users can scroll through their chosen story to find a visually appealing version of key information in the RGS Monitoring Report, enhancing their understanding of the RD.
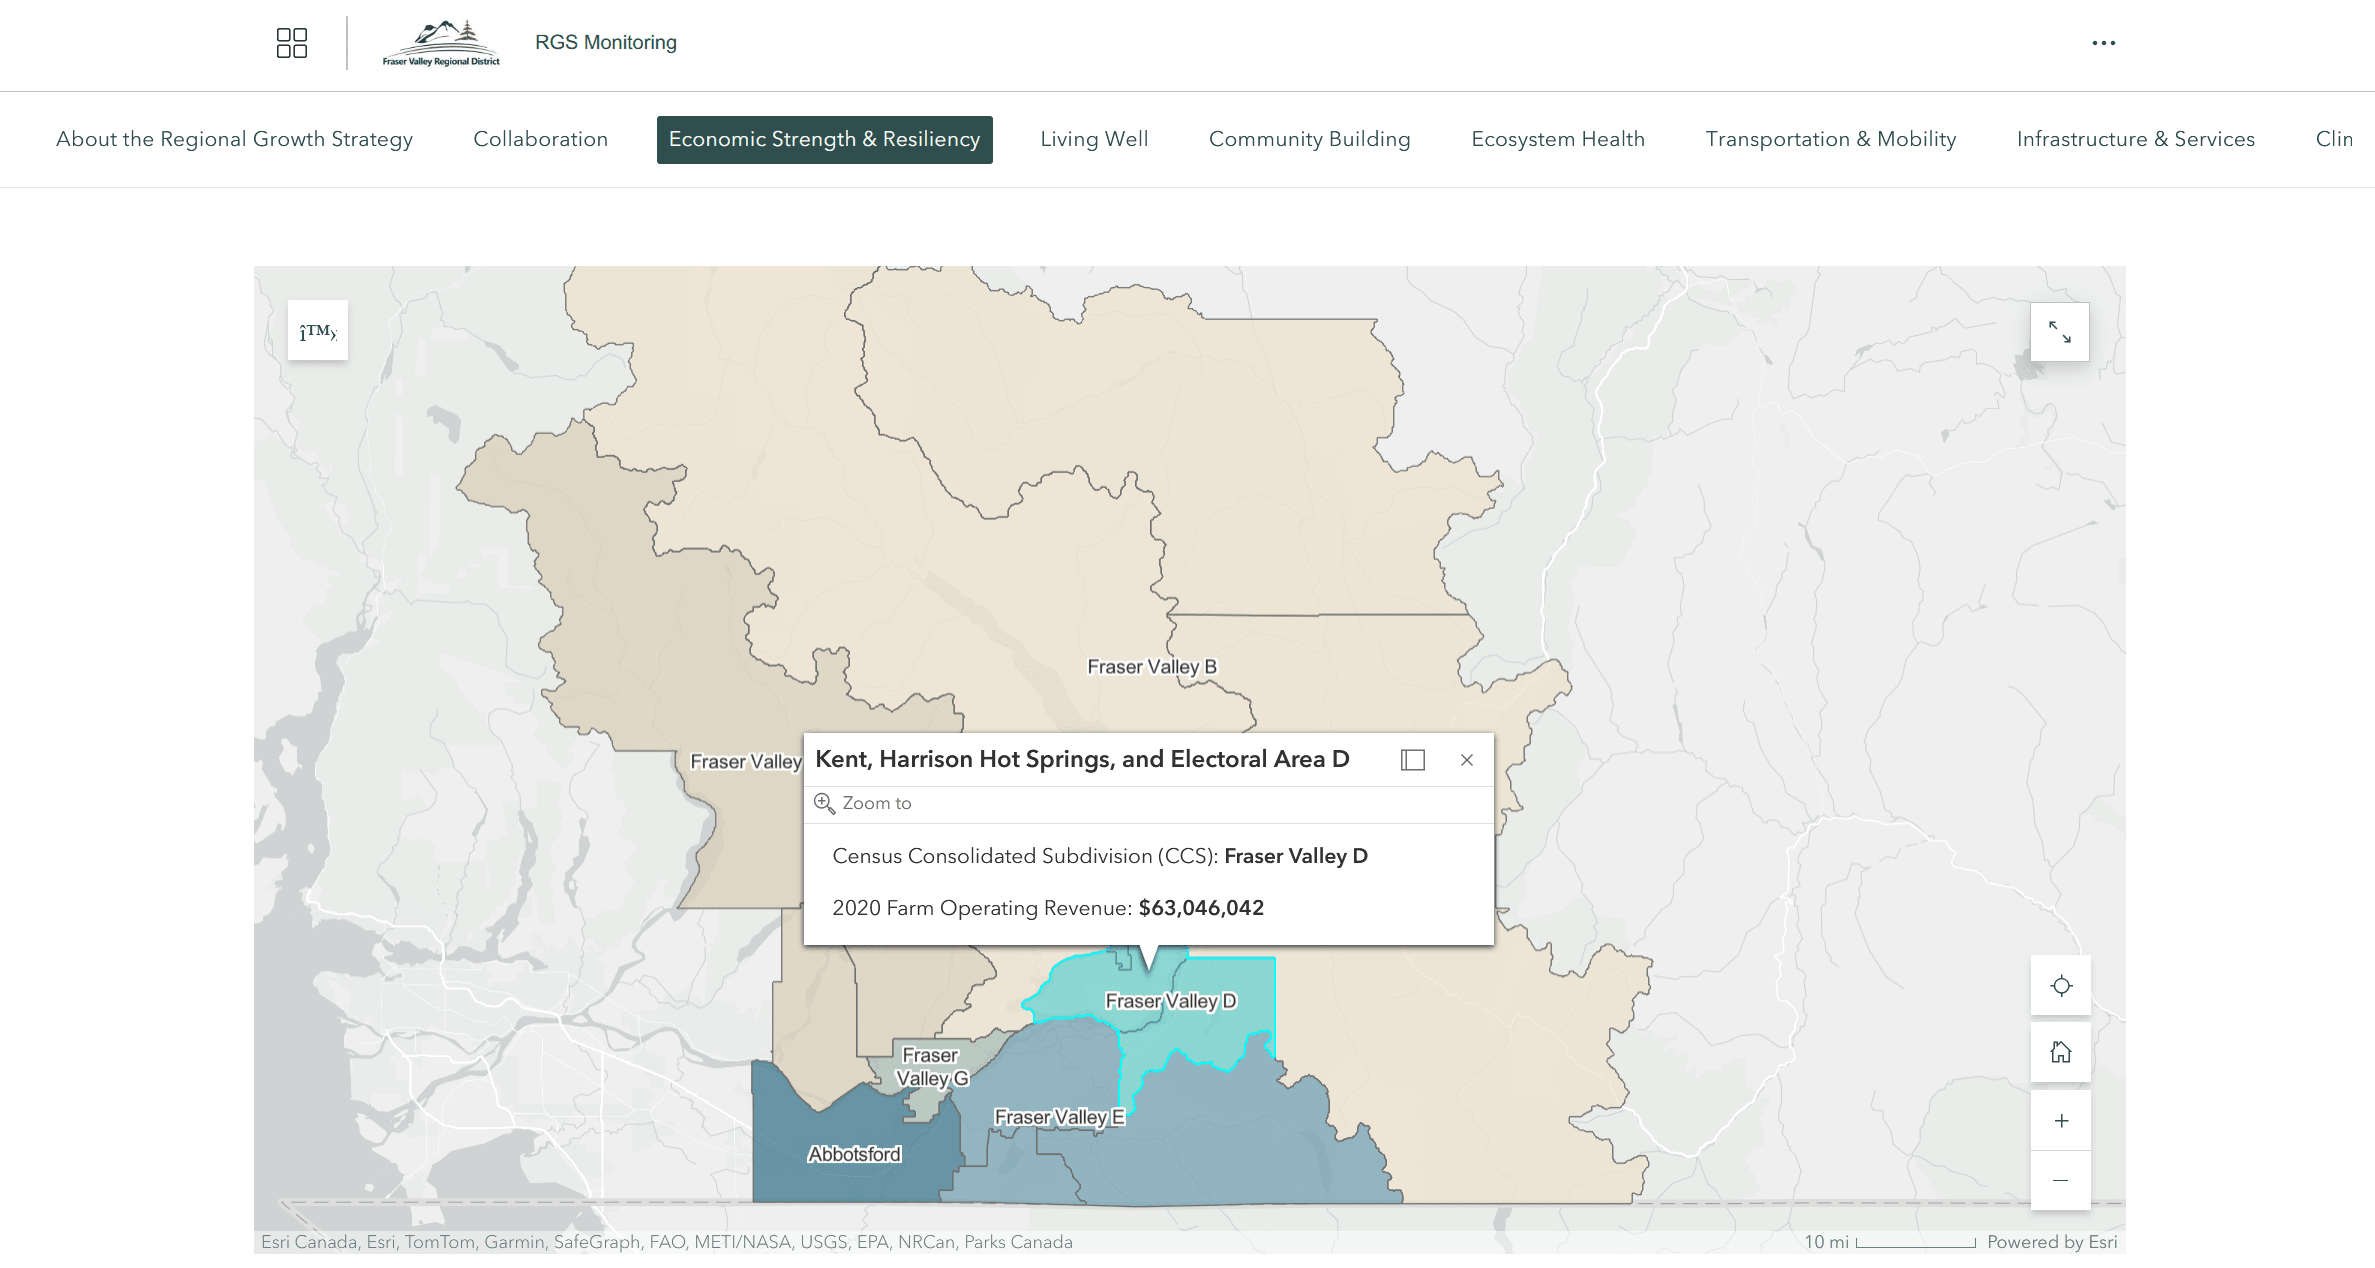
Maps embedded in the RGS Monitoring stories enhance readers’ understanding by giving them visually appealing context for statistics captured in the report.
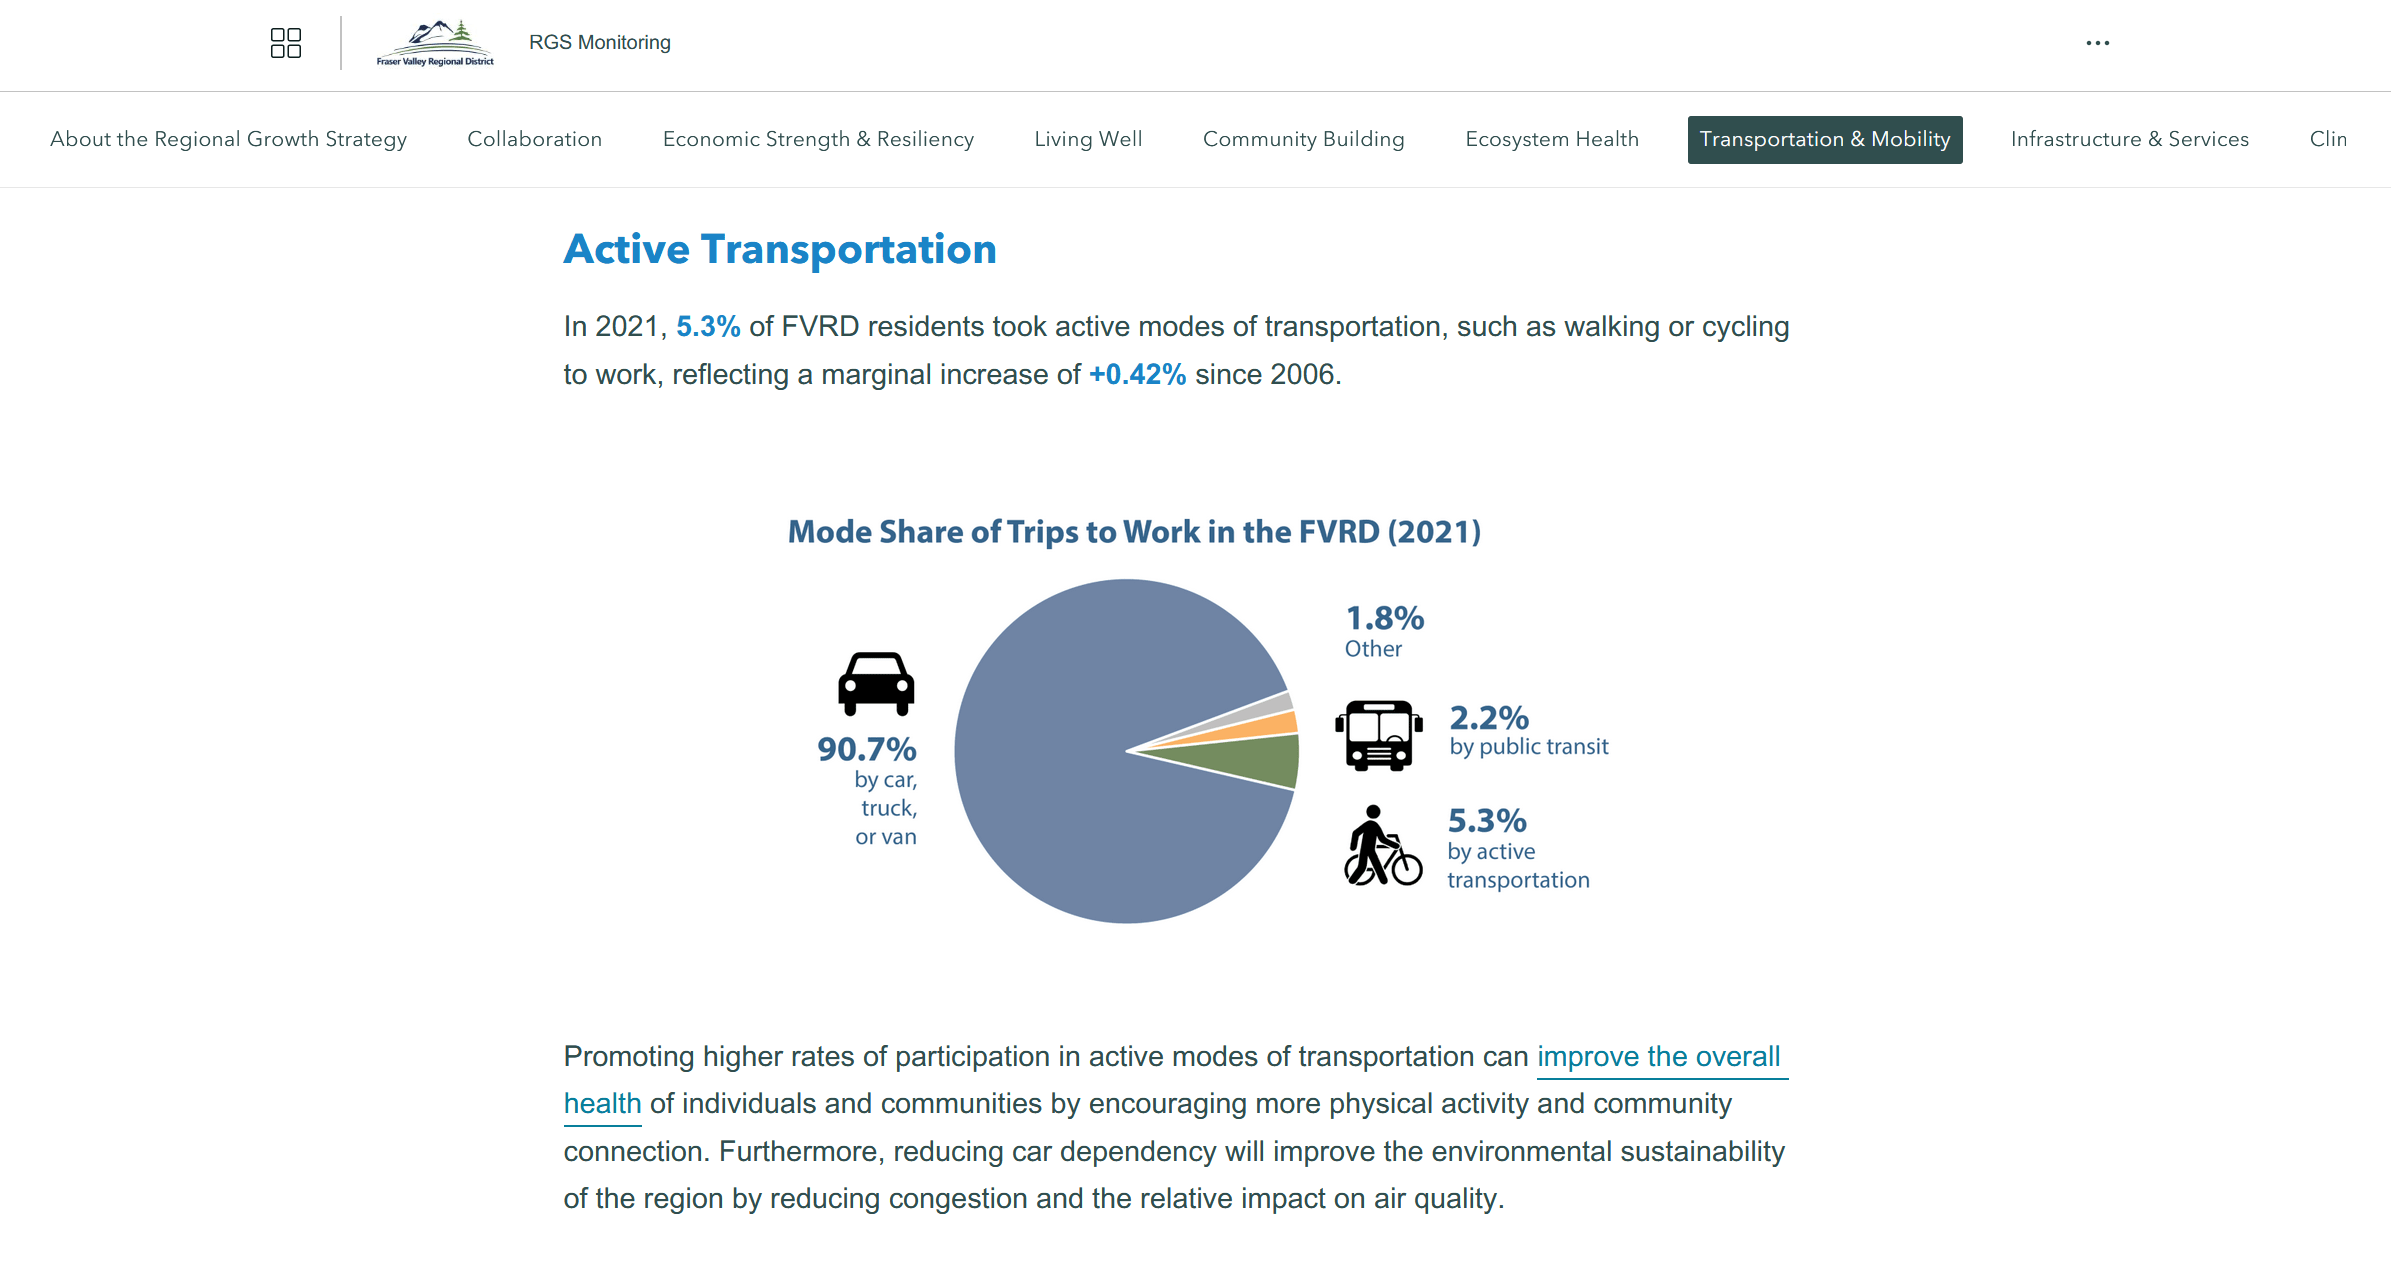
The FVRD’s RGS Monitoring stories also include compelling visuals from the original monitoring report—including infographics, charts and information tables.
By using StoryMaps to communicate a high-level version of the Monitoring Report, the FVRD has been better able to educate and inform the public about the RGS. The combination of visuals and narrative text made complex regional planning concepts more accessible, fostering a better understanding of the RGS among residents and businesses.
As Alison Stewart, manager of strategic planning at FVRD, puts it: each of the stories in the FVRD’s Monitoring Report collection serves as a “lobby” for the greater report: if a reader is intrigued by what they see and wants more information, details are available via hyperlink.
Better communication leads to better response
ArcGIS StoryMaps has transformed the way the FVRD communicates with residents and businesses. The interactive StoryMaps collection and the stories within make it easier for the community to engage with the RGS Monitoring Report and the RGS.
And because of the embedded maps, users of the stories are better able to zoom into their own areas and understand how the changes being reported in the RGS Monitoring stories are truly affecting their areas.
Not only that, but the StoryMaps collection has been positively received by elected officials in the area for its look, feel and ease of use.
The collection has also reduced the burden of information requests from internal departments and external ministries and agencies, allowing the FVRD’s planning group to focus on more pressing matters.
“I’ve been a very firm believer in the use of GIS as a planning tool for more than 20 years. An important part of planning is communicating complex concepts and ideas to the public and making it more understandable for them. Tables and charts just don’t cut it when technology like StoryMaps makes it so much easier to communicate the same data visually. When people can see where they live, and information about what’s around them, they’re able to understand in their own way what that information means. It makes communicating with the public so much more fruitful than it was ten or twenty years ago.” —Alison Stewart, Manager of Strategic Planning, FVRD
A path forward for planning communications in the digital age
By using technology to communicate the outcomes of the RGS with residents, the FVRD is paving the way for a more informed and connected community.
This innovation doesn’t come at a high cost: StoryMaps is included in FVRD’s existing GIS user types and it’s easy to use, meaning that the FVRD’s planning group can easily work on its stories without extensive training or reliance on GIS, IT or web resources. This flexibility will empower the planning team to maintain the RGS Monitoring stories in future years, as growth continues to change the region.
As communities continue to grow and evolve, conveying complex information in an engaging and accessible manner will be critical. Riley Smith, a planner with the FVRD, has a word of encouragement: “For other local governments who have planning strategies to report on and indicators to monitor, but who may be limited resource-wise: you can do this digitally! You can do it differently.”
Want to explore more ways that planners are using digital storytelling to engage the public? Check out this story. Or, for more on how one organization is using a map-enabled application to turn hikers into eco-advocates, check this one out. For more on the technology itself, discover how to build your own digital stories and presentations with maps using ArcGIS StoryMaps.