5 differences between the geometric network and the Utility Network
Journey with Esri Canada certified ArcGIS instructor Oli Helm as he writes about what he learned while researching the ArcGIS Utility Network.
In my role as a certified ArcGIS instructor at Esri Canada, I have the privilege of teaching customers how to work with their utility data. Previously, we used the geometric network to model electric, gas and water networks; now we use the ArcGIS Utility Network. I’m learning the new technology so that I can share my knowledge with customers in my training courses. Here are five differences I’ve discovered between the two types of networks.
1. Where did all the feature classes go?
Well, the feature classes are still there, it’s just that they’ve been streamlined. The graphic below shows an example of the feature classes used for a water distribution network.
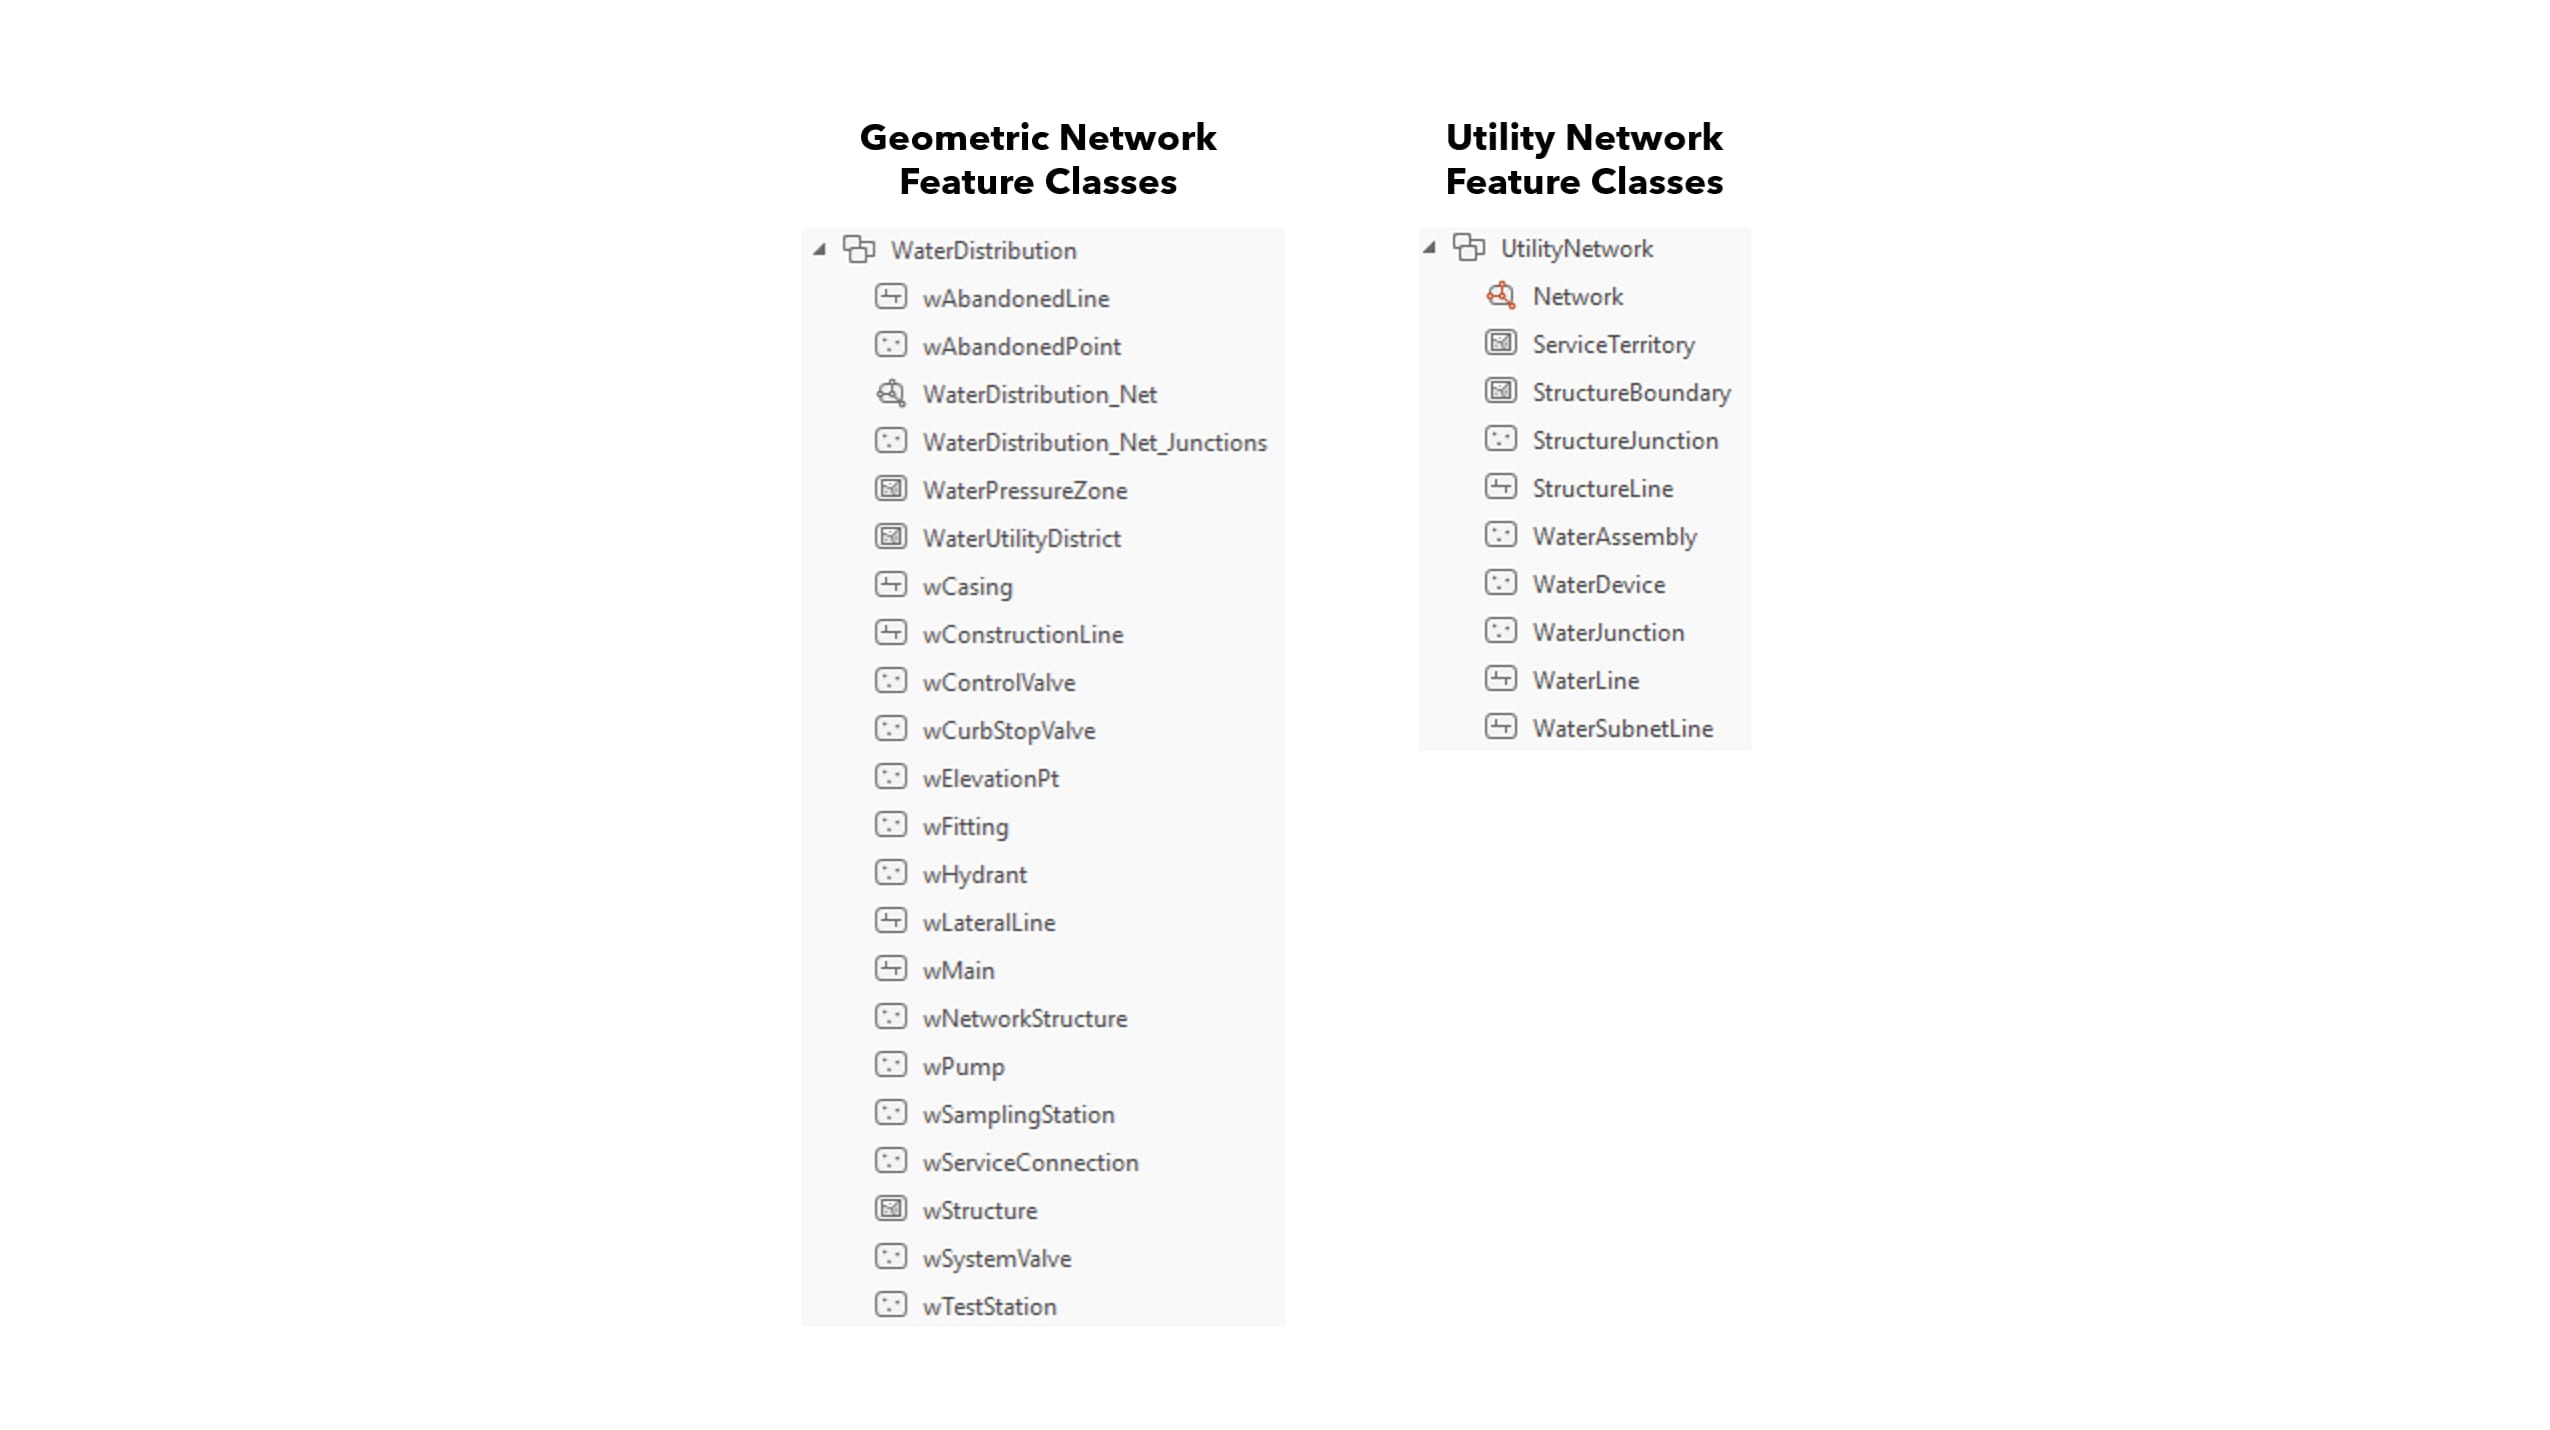
Figure 1 – Example of network feature classes in a geometric network compared to the ArcGIS Utility Network.
All of the “Junction” and “Edge” feature classes from the geometric network have been rolled up into the “WaterDevice, WaterJunction and StructureJunction” and “WaterLine and StructureLine” feature classes in the Utility Network, respectively. This streamlining was hard for me to accept at first because I had always learnt that you model the various features based on theme and attributes and yet, now I’m told that we can just throw all the points together into one giant feature class.
Fortunately, the AssetGroup and AssetType fields in these feature classes allow us to distinguish the different types of features and subtypes that were previously modelled in the old system.
One reason for the streamlining of feature classes is that it improves performance in a number of ways. First, when accessing the data, there are less requests for the geodatabase to process since there are fewer feature classes. Second, the data can be sent over the network more efficiently given that it comes from fewer feature classes. Third, there being fewer feature classes simply makes it easier for the geodatabase administrator to manage their ArcGIS Enterprise implementation for processes like permissions, versioning and publishing as feature services to the ArcGIS Enterprise portal.
2. The Utility Network is complex
Wait a sec, didn’t things get simpler because of less feature classes? On the surface, visually, yes. But behind the scenes there is a data model that has loads of relationships baked into it to handle connectivity and various types of associations, like containers, attachments and non-geometric connectivity.
For example, with the geometric network, you can define connectivity rules to model edge-edge or edge-junction connectivity. But the features have to be coincident with each other. The Utility Network relies on coincidence as well, but can also use associations that allow you to model connectivity, containment and structural attachments between nonspatial and noncoincident network features.
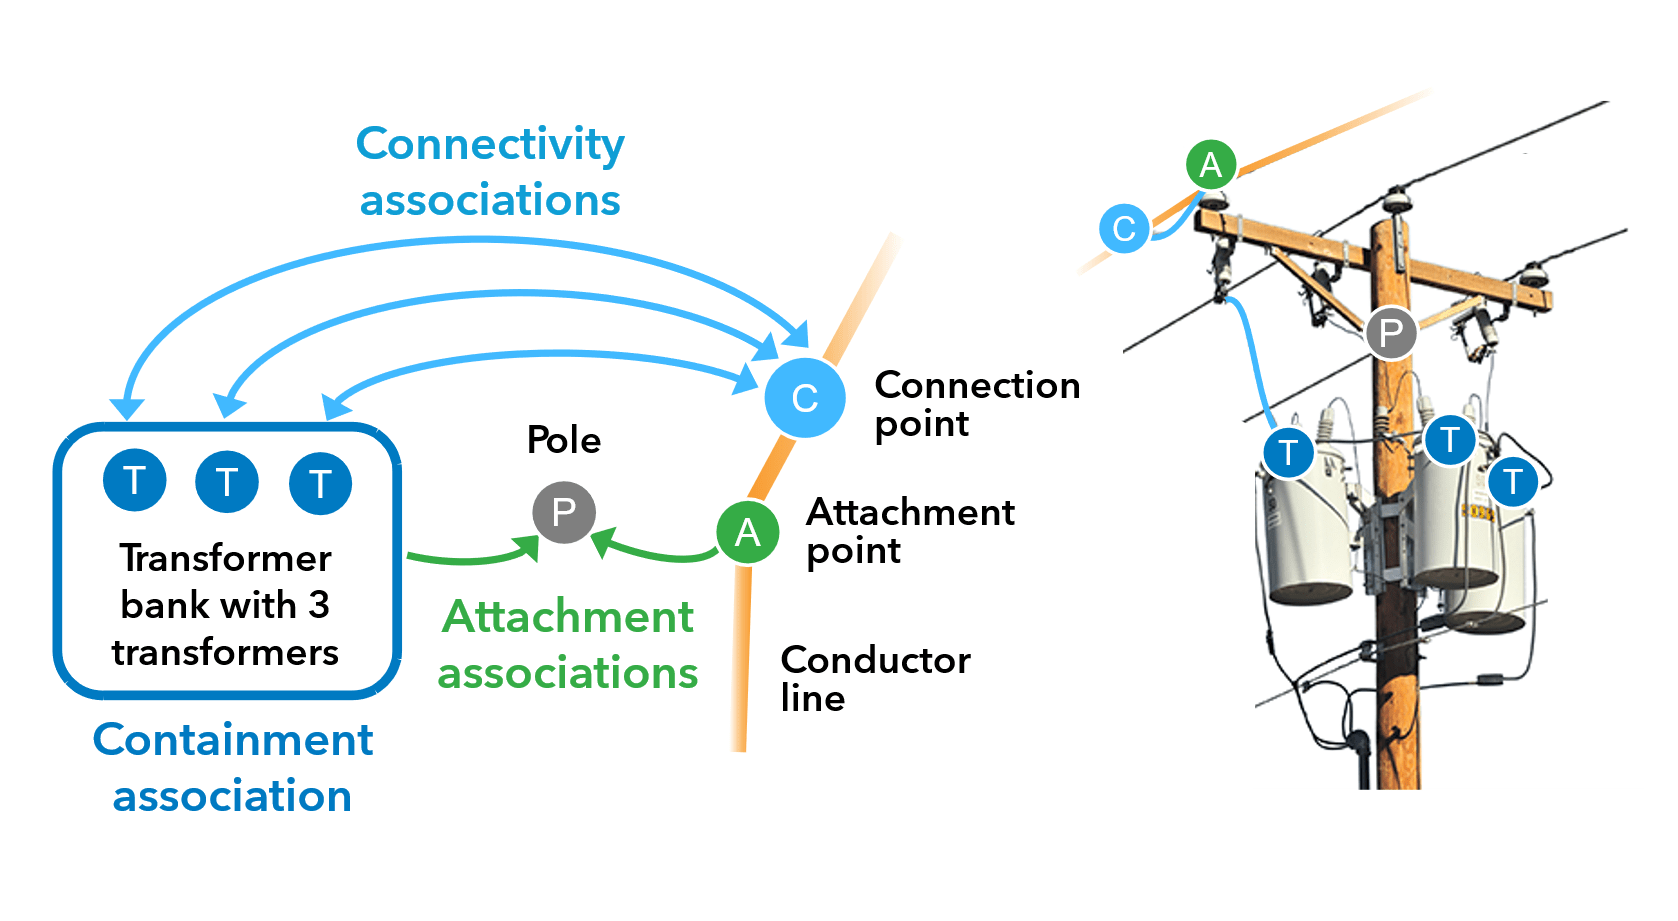
Figure 2 – Associations are used to better model the real world with GIS data.
The Utility Network also makes it easier to separate out and model the structural network, such as the power poles that are used to support the domain network, which are the power lines and transformers where the electricity actually flows. And then, each domain network has tiers and subnetworks that give more flexibility and precision in modelling the resource, particularly when it comes to doing tracing.
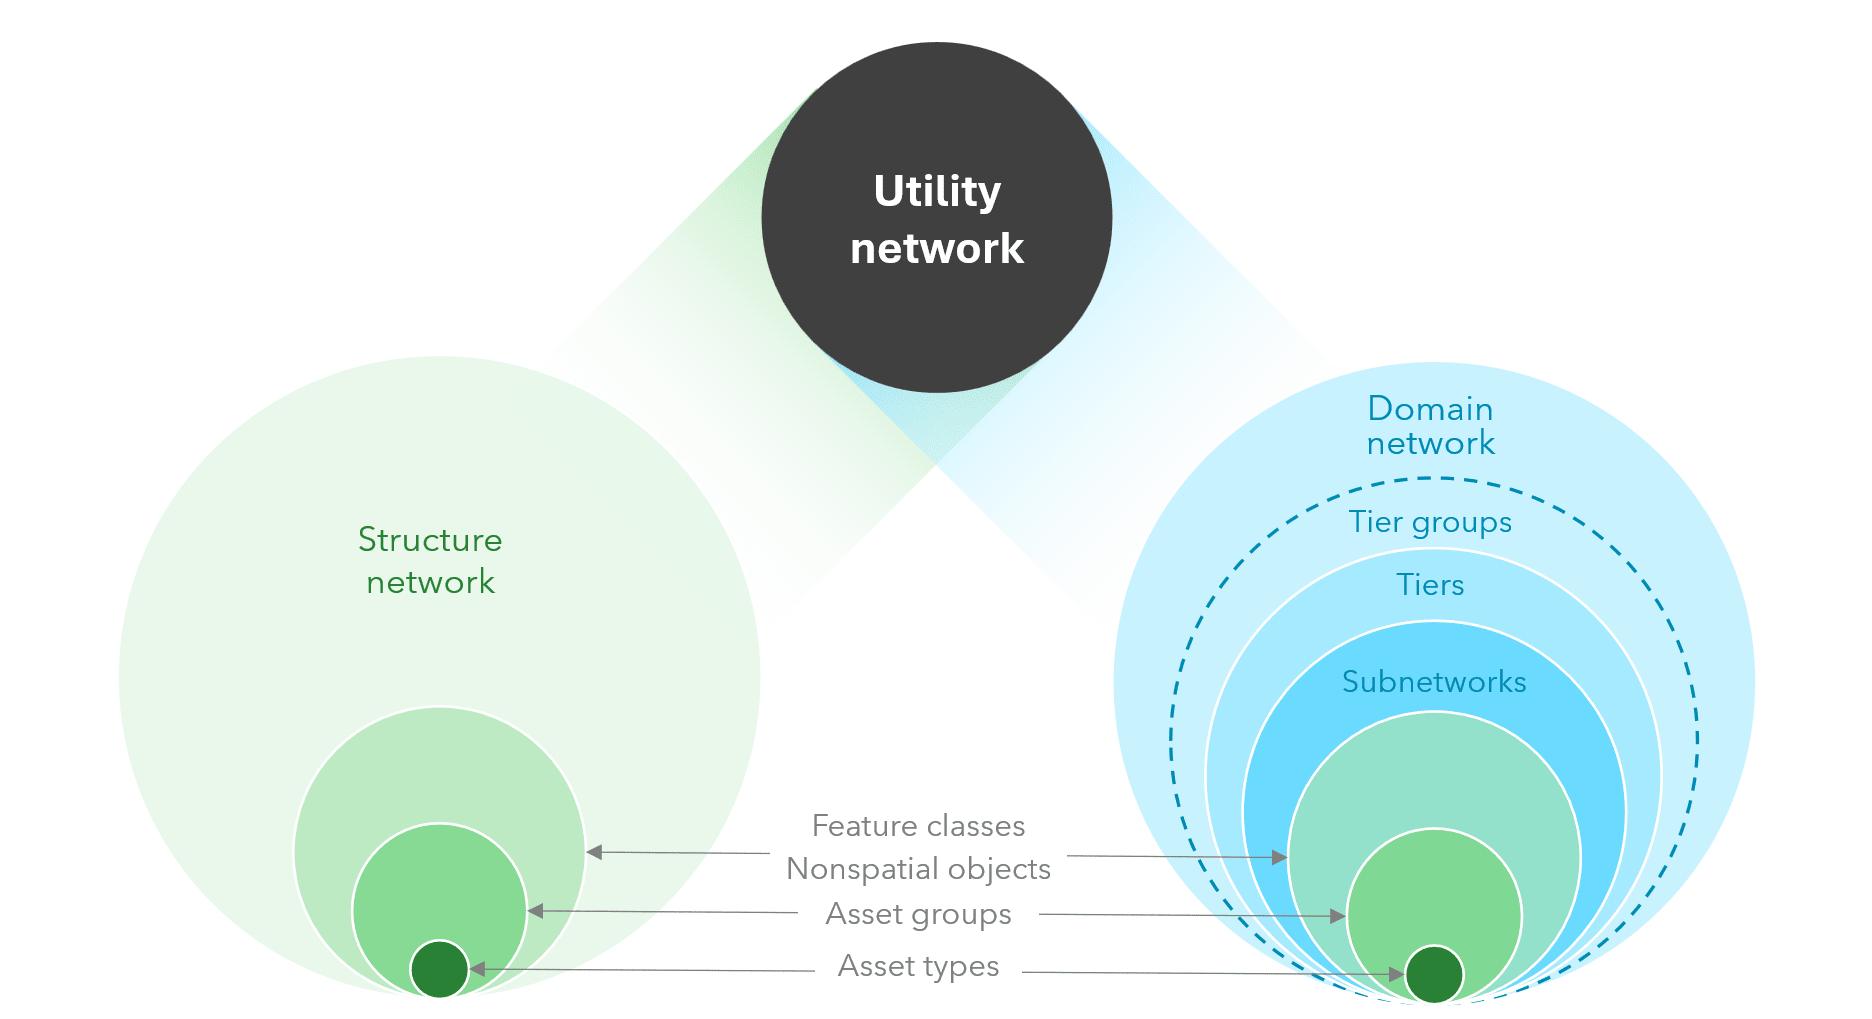
Figure 3 – Elements of the Utility Network
All these new terms are a bit overwhelming to me, but I see it as a tradeoff: far more complex than before but with more and better functionality.
3. There are better tracing options
Speaking of tracing, it is so much more flexible and precise in the ArcGIS Utility Network compared to the geometric network. For example, traversability has been introduced, which considers a trace configuration. In a geometric network, if I do a “find connected trace” operation, I will get all the features returned that are connected based on their coincidence. On the other hand, with a utility network, I can do a trace on a subnetwork controller to only get the features returned that are connected to that subnetwork.
The subnetwork controller is an example of a network category, which is simply a tag that represents a characteristic of an asset in your network. These tags are part of the data model and are used in queries and traces to make it easier to work with your utility network.
4. The Utility Network is the first fully services-based product for ArcGIS Enterprise
The geometric network was designed to be used in a desktop-based application. Today, we design products to be used across the web so that more users can connect to the data using easier to work with applications. My favourite example is the field worker who needs to do an asset inspection. It used to be a multi-step and laborious process to get the inspection information from a piece of paper that was filled out by the worker into the corporate database. Now the inspector goes to the asset location, opens up ArcGIS Survey123 to fill out a dynamic form that has the asset ID already populated based on their location, and on submission the data immediately updates the corporate database via the Enterprise portal.
Better yet, we can even track the edit and make sure the person is authorized to edit via branch versioning.
So, the services-based approach means that all the utility data are published as feature services and then all applications consume the same feature services. No duplicate data, no duplicate processes, real-time updates and focused web-based applications that just do the one or two things you need to do without getting overwhelmed by the hundreds of buttons and tools that are in ArcGIS Pro! Of course, you can still use ArcGIS Pro if you need that functionality as it can also work with the feature services directly, but for most users there is a simpler app to use for working with the network.
5. There is a nifty little diagramming tool
Years ago, I learnt about ArcGIS Schematics, which was an extension in ArcMap that took the geographic location of data and simplified it into a schematic diagram, commonly used by engineers to visualize the key components of their network. It was pretty cool how the data could be translated from one view to the other, but that product was only for ArcMap and was eventually deprecated in 2024. However, I am happy to see that the technology lives on in the Utility Network as the Network Diagram and is better than before.
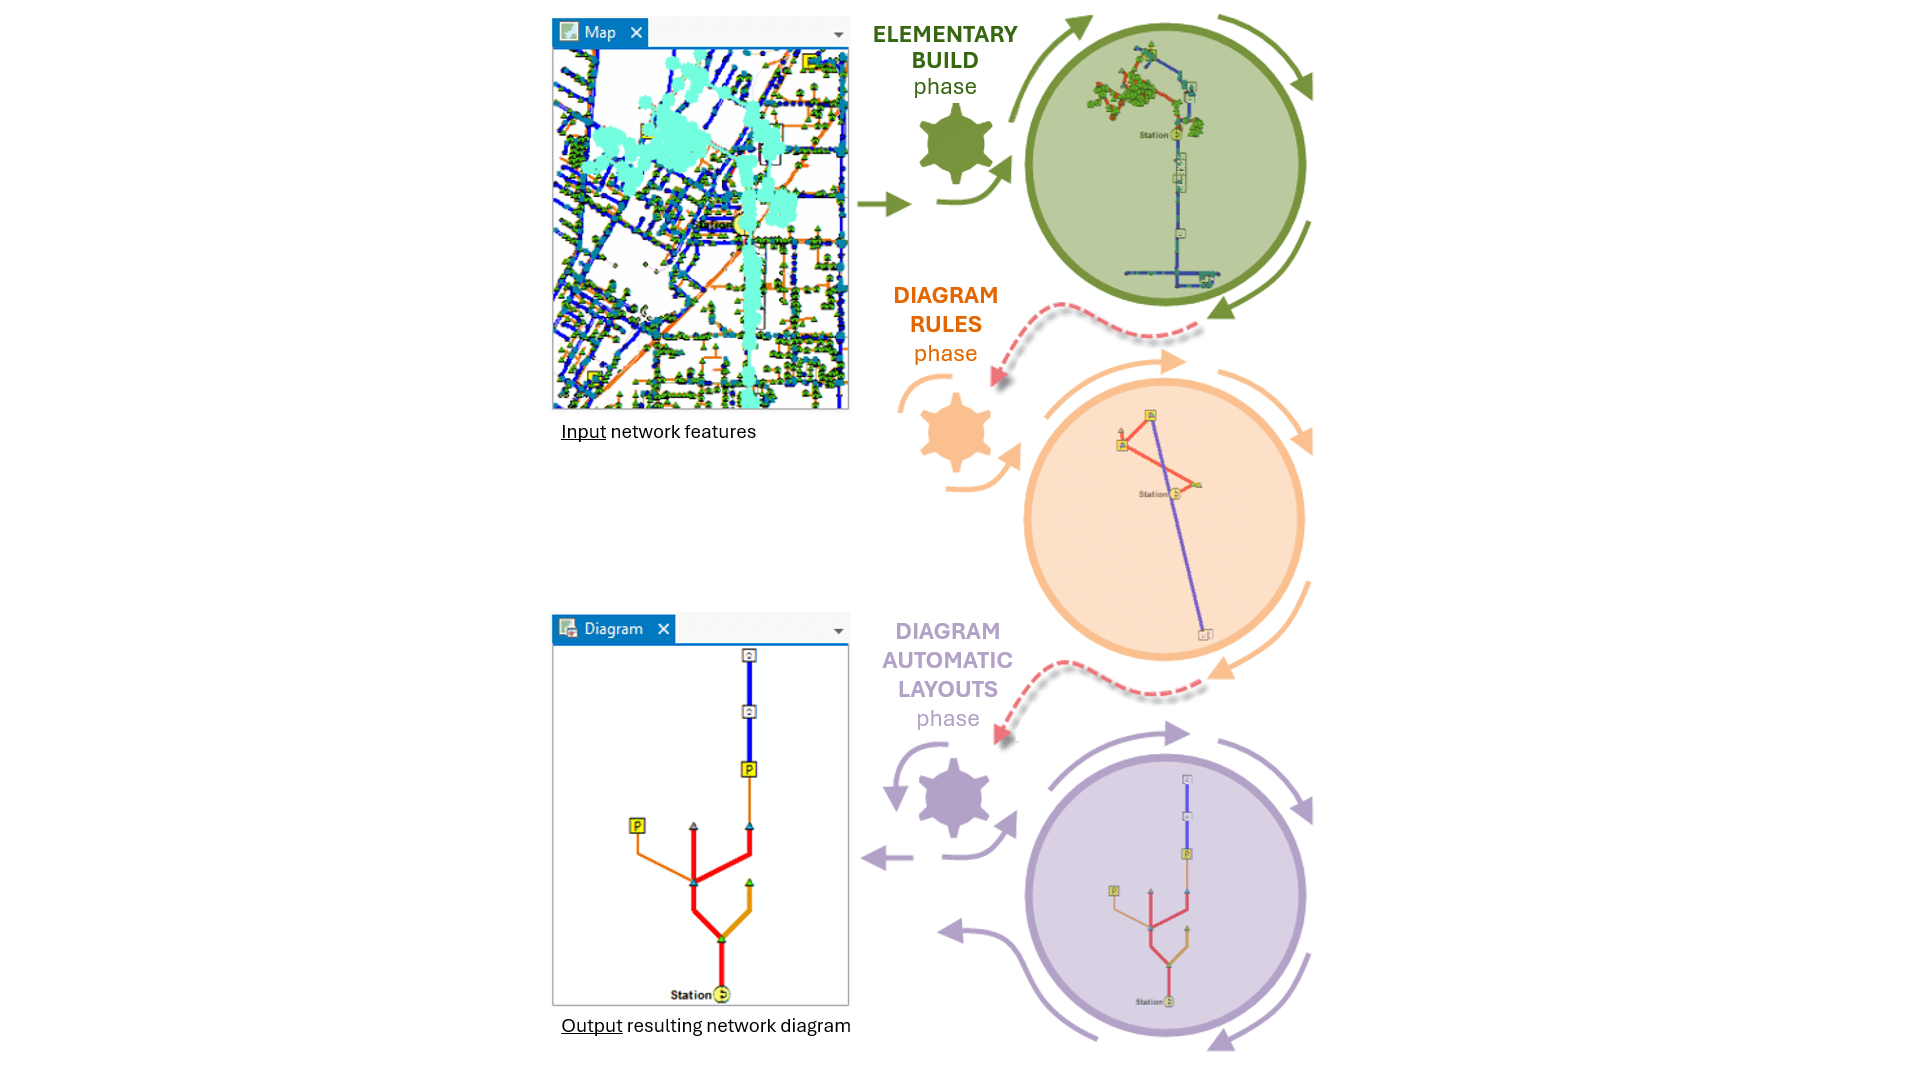
Figure 4 – Creating a network diagram from your source data.
In the graphic above, you can see how you start with a selected set of features, often derived from a configurable trace, and then you can generate a simplified diagram from those features. There are different rules and layout options that allow you to manipulate properties such as the symbology or labeling for the entries in the diagram in the same way that you would a typical data layer in a map.
Summary
To be clear, migrating to the Utility Network from the geometric network is difficult and time consuming. It’s not just the new language and functionality that one needs to learn, which is hard enough. It is moving the data into the new data model that I think is the biggest challenge. But once you are there, the Utility Network is pretty amazing at how it does a better job of representing your utility data and making it available to a wider audience of users compared to the geometric network.
One last thing to mention if you are still hesitant to make the leap. I just recently discovered that you can convert a geometric network to a trace network, which is a way to work with a simple connectivity model. It’s not recommended for utility networks but it may be good enough if you just need something simple to move to. I found this ArcGIS StoryMaps story on the topic that may be useful to get a better understanding.
If you’re interested in learning more about working with utility networks in ArcGIS, check out our upcoming instructor-led course, Working with Utility Networks in ArcGIS. If you’ve already taken this course or want something more in-depth, try Configuring Utility Networks in ArcGIS.
Want to stay informed about all the latest training opportunities at Esri Canada? Visit Esri Canada’s Communication Preference Centre and select the “Training” checkbox to get a monthly roundup straight to your inbox.