GIS Projects: Triaging Considerations Series - Part 2
Continuing in this 6-part series on a 6-pillar framework to help navigate and prioritize GIS projects - Part 2 addresses understanding risks. By the end of the series, you'll have a handy guide to assist you in triaging projects, making the process smoother and more manageable. If you stay tuned until the end, I’ll also include a cheat sheet to help.
As prefaced in Part 1, it's important to note that this framework is based on my experiences as a consultant and technical solutions specialist. It draws from personal project-level experience and relative risk assessments and may not fully align with your organization's stance on technology, training and capacity, business workflows or security and privacy.
The Six Pillars for GIS Project Triage Consideration
Framework for triaging contains 6 pillars
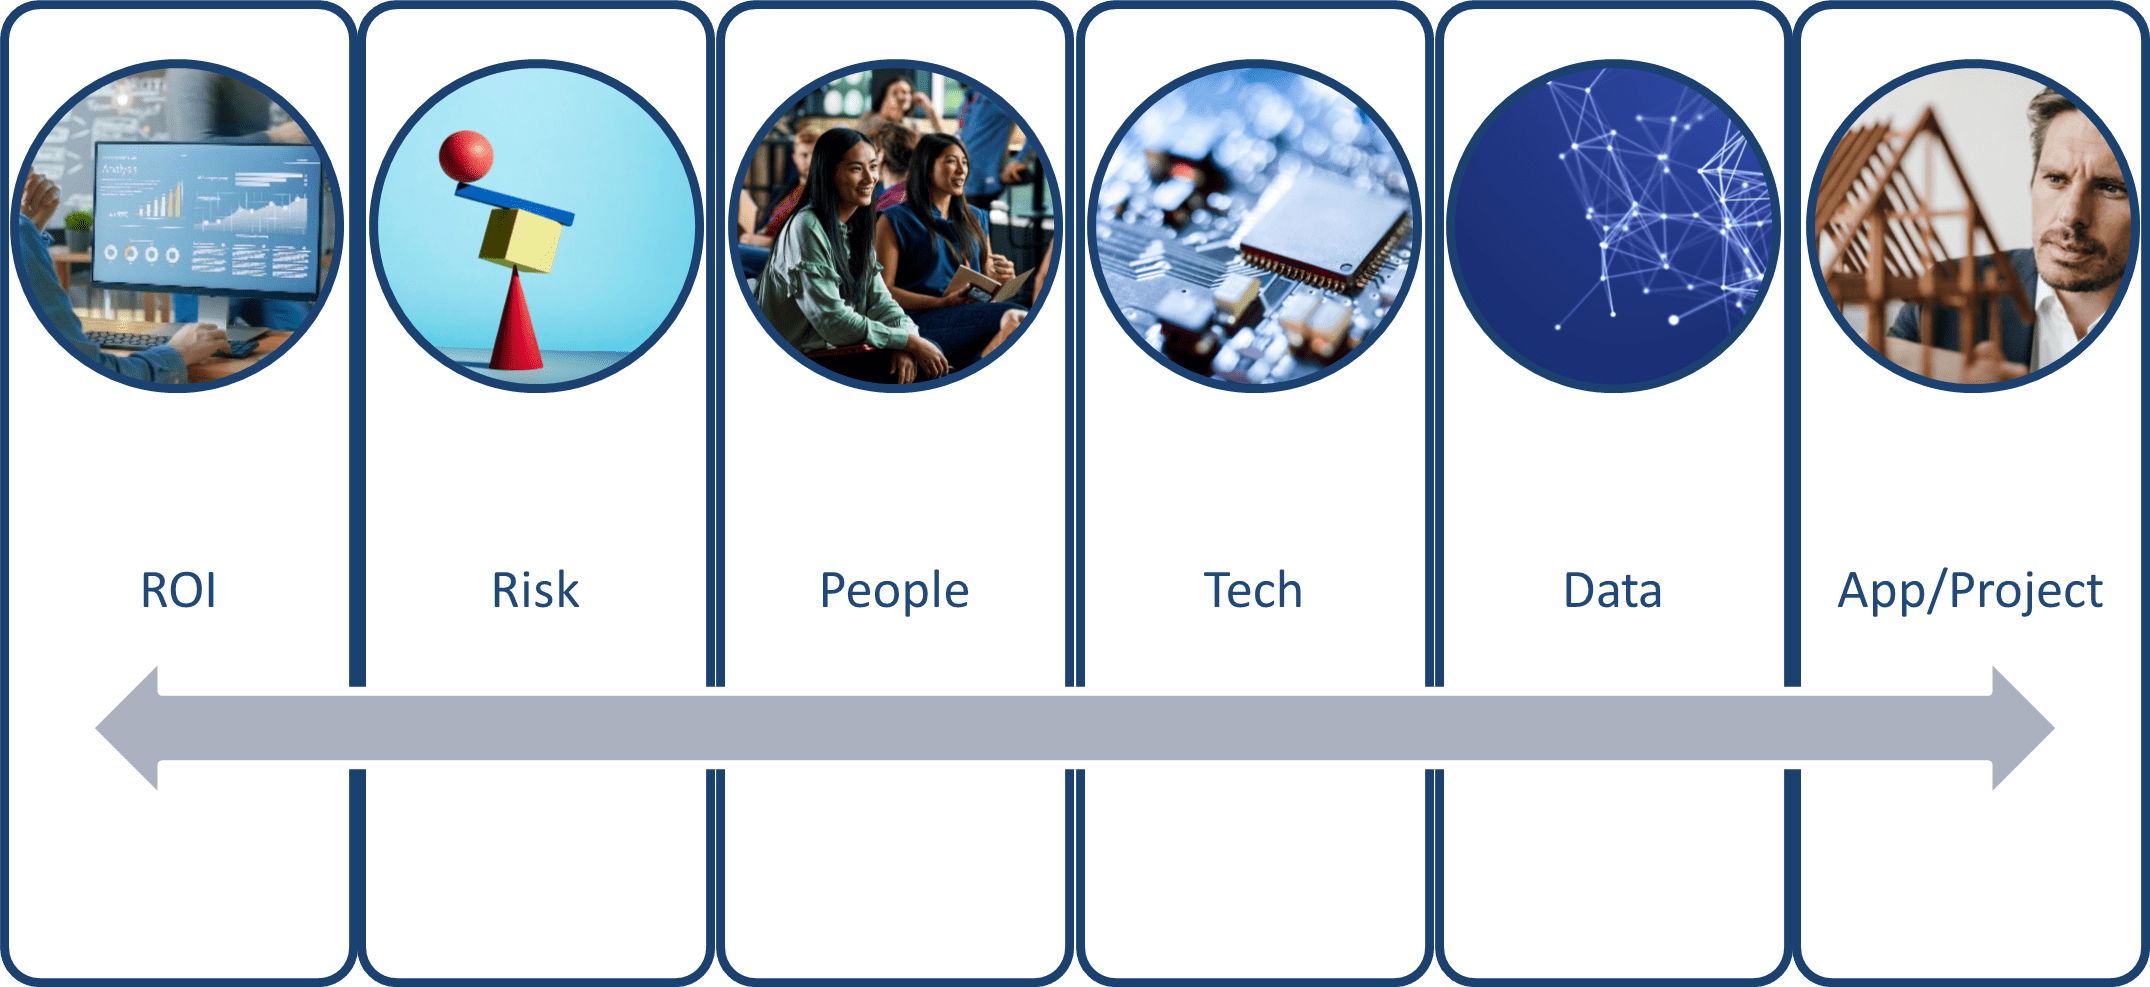
Just to review from my previous post, this framework considers six pillars for triaging GIS project requests:
- Return on Investment (ROI): Does the project have a tangible return on investment?
- Risk: What associated risks are anticipated with the project?
- People: What capacity is required for the project and its sustainment throughout its typical lifecycle?
- Technology: What pieces of technology or equipment are required to ensure the project's success?
- Data: Is the data involved in the project accurate, secure, accessible, and timely?
- Application & Project: What are the project deliverables, outcomes, and measures of success?
This blog post will focus on understanding possible risks to a successful project implementation.
Understanding Risk

Understanding Risk
As a certified security risk management professional, I have spent many years helping clients reduce corporate risk and proactively avoid events or scenarios that could negatively impact their ability to achieve business goals. Risks can come from many sources and create a chain reaction known as associated risk. These sources are called threats and managing them involves understanding the risk (or likelihood) of these threats happening.
When a project goes wrong, it can lead to negative outcomes for the organization, such as financial loss, damage to reputation, operational disruptions, legal and compliance issues, resource drain and even lower employee morale. By evaluating a potential project using a risk (likelihood) framework, we can prioritize projects more effectively. I am introducing a very simplified way to understand risk, which helps quickly decide whether a proposed project needs a deeper threat analysis or can proceed.
The Risk Matrix
Risk Matrix
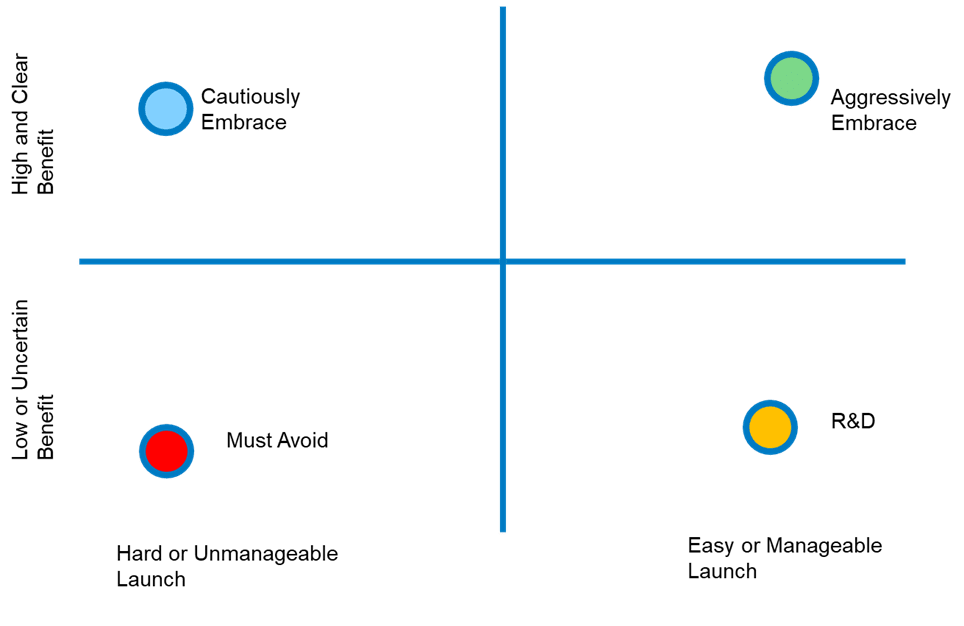
The graphic above illustrates quadrants where a potential project may land on the risk matrix. Along the horizontal axis, we evaluate whether a project will be easy or hard to launch and whether it will be manageable or unmanageable post-implementation. Up the vertical axis, we assess whether the project has a low and uncertain benefit or a high and clear benefit.
A project that is easy to launch and has a high and clear benefit would likely be prioritized higher than one with a lower benefit and a harder launch capability. Projects that are easy to launch but have uncertain benefits may require more time to research to develop their business value proposition. Proposed projects that are considered high value but have a riskier implementation timeline should be approached cautiously and may necessitate a more formal project management methodology.
Understanding Audience Needs

Audience Needs
The illustration above exemplifies how I might evaluate risk differently than a public-facing organization. While I might view a project that expands open data to the public as higher risk, a public-facing organization might see it as a risk-reducing activity, particularly concerning its reputation and commitment to transparency.
When evaluating a proposed project, understanding the primary audience it will serve can inform the perceived risk level. An application that serves a specific set of internal staff and departments may be considered low risk because it doesn't need to adhere to the same web standards as a public-facing application. The risks increase as the target audience broadens, likely requiring more functional and non-functional requirements. If a project involves an audience of contractors and consultants, it introduces specific risks related to the organization's security and privacy.
Understanding the target audience of the project will better inform the nature of its risk.
Understanding Buy-in

Understanding Buy-In
For a project to succeed, it must gain support, approval, and agreement from stakeholders. Without consensus or alignment among team members, the risk of failure increases.
If a project requires only internal buy-in (typically a smaller project affecting a limited audience), the risk is low. However, as the profile of the stakeholders becomes more prominent, the risk also increases. For instance, a GIS project might be mandated by a higher authority, such as a Province or State legislating affordable housing targets for each municipality, which could override any official community plan (OCP). This mandate might trigger a GIS project that does not align with the municipality's mission statement but is required by higher authority. The risk escalates if these housing targets must be met within a compressed timeline.
A GIS project may also carry significant risk if the deliverable is a demand or request from the public. Synthesizing functional and non-functional requirements from the public can be resource-intensive and require substantial commitment and effort from the GIS department.
Understanding the risk to a project's success in relation to its stakeholders helps make informed decisions on how best to prioritize the project.
Understanding the Team

Understanding the Team
A common barrier to successful project completion is ineffective sponsorship, championship, or leadership. The project team should have a sponsor who collaborates with the business area champion and technical leadership to create an environment where the GIS team can perform effectively.
- An Executive Sponsor should clearly articulate how the project aligns with the organization's strategic vision. They must have the influence and authority to secure necessary resources, overcome resistance and advocate for the project at the highest levels.
- The Business Area Champion should provide subject matter expertise and clearly communicate the project's value to motivate support. They should advocate within the business area, identifying and addressing potential issues early. Ideally, the champion involves end-users and other stakeholders early in the project proposal process to ensure it meets their needs.
- Technical Leadership should possess deep technical knowledge and guide the team through the project's challenges. They should bridge the gap between technical and non-technical stakeholders, ensuring clear and effective communication. Technical leaders protect the technical team and manage project change requirements through established project management methodologies.
The proposed project, no matter the size, should have a stacked team committed to the success of the project.
Understanding the Solution’s Level of Effort
Understanding the Solution's Level of Effort
Understanding the level of effort in a GIS project is crucial for accessing its risk. It should be noted that your business and technical needs or capabilities may not align with the ratings I have assumed. Consider this:
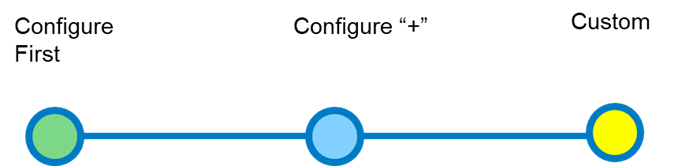
- Configure Only (Lower Risk) – These projects involve out-of-the-box configurations, functionalities, and templates from the ArcGIS ecosystem with little to no coding required. They offer high predictability due to standardized features and lower complexity by avoiding extensive coding or development. Such projects can be quickly implemented since the work is primarily configuration-based, resulting in lower costs due to the reduced need for DevOps experts. However, there may be some risk as configure-only projects might not provide the flexibility or full functionality required.
- Configure + (Increased Risk) – To add more flexibility and functionality, some level of customization may be considered. This could include scripting with Arcade, editing JSON for applications and map layers (using a tool like ArcGIS Assistant could accidentally delete or updating something which has unintended consequences), automation with Python, or integrating partner tools and extensions. Predictability becomes variable with these custom elements, increasing the project's complexity and management needs. Consequently, timelines may be longer and costs higher compared to configure-only projects, due to the need for specialized resources for development and testing.
- Custom (Higher Risk) – Projects requiring extensive development, such as building new functionalities, custom interfaces and complex API integrations, involve a significant level of effort. Custom-developed applications offer the lowest predictability and reliability due to the high degree of development work, requiring extensive coding, testing and debugging of unforeseen complications. Adopting a formal project methodology can mitigate risks and manage the longer timelines and higher costs, as these projects need highly specialized resources for extensive development and iterative testing. Additionally, scope creep is a common challenge in such projects.
Understanding the project's level of effort helps assess its risk, enabling sponsors, champions, and leadership to make informed decisions on how to proceed.
Understanding Criticality
Understanding Criticality
Understanding the criticality of a GIS deliverable or application is essential for assessing risk because it helps determine the potential impact of failure or issues. Here's a breakdown of how different levels of criticality represent varying degrees of risk:
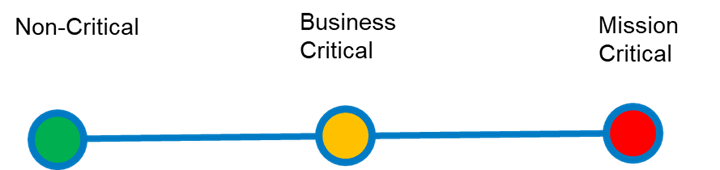
- Non-Critical Deployment (Low Risk) - Generally, non-critical deployments are considered low risk because their failure or issues do not significantly impact business operations. For example, a GIS application used for internal training purposes might fall into this category. However, even non-critical deployments can become high risk if they involve sensitive data, have regulatory implications, or if their failure could lead to reputational damage. For instance, a public-facing GIS map with minor errors might still cause public confusion or dissatisfaction.
- Business-Critical Deliverable (Medium Risk) - Business-critical deliverables are those that directly support essential business functions. Their failure can disrupt operations but typically does not pose an immediate threat to the organization's survival. An example might be a GIS application used for daily business analytics and decision-making. The risk level can vary based on factors such as the complexity of the application, the availability of backups, and the ease of recovery. If the application is complex and lacks redundancy, the risk might be higher.
- Mission-Critical Application (Higher Risk) - Mission-critical applications are those whose failure can have severe consequences, potentially threatening the organization's survival or causing significant harm. Examples include GIS applications used for emergency response, critical infrastructure management or national security. These applications require the highest level of reliability, security, and performance. Any downtime or failure can lead to catastrophic outcomes, such as loss of life, significant financial loss or severe legal repercussions.
In summary, understanding the criticality of a GIS deliverable or application helps in identifying the potential impact of its failure and the necessary measures to mitigate risks. The more critical the application, the higher the risk and the more stringent the risk management strategies need to be.
Understanding risk is crucial for managing GIS projects effectively. By evaluating the potential impact of failure, organizations can implement appropriate risk management strategies. Assessing risk is a foundational step for discussing other topics in future posts. In my next post, I will explore evaluating the capacity of people resources to successfully complete a project, focusing on how team availability and expertise influence project risk and success.
Read part 3 - now available