Designing Community Basemaps with the ArcGIS Vector Tile Style Editor: Part 2
Basemaps don’t have to be basic or boring. You can design them to suit any creative theme you like, from mimicking minimal Apple basemaps to designing fruity maximalist maps using Paul Cézanne’s oil paintings. Check out this blog post to learn the main steps of basemap design and for an overview tutorial of ArcGIS Vector Tile Style Editor.
This is the second blog of a three-part blog series about designing custom community basemaps using the Community Map of Canada and the ArcGIS Vector Tile Style Editor: the first blog discussed the endless possibilities of creative basemap design, and the third blog will share design tips and answers to FAQs. This second blog in the series involves a tutorial of the ArcGIS Vector Tile Style Editor and outlines the main steps of basemap design.
Continue reading this blog to learn the steps of basemap design and how to produce basemaps that look like these:
How to use the ArcGIS Vector Tile Style Editor to customize your basemaps
The ArcGIS Vector Tile Style Editor is an Esri web application that allows users to interactively create custom basemap styles for Esri vector basemaps or self-created vector tile layers. The editing application allows for customization of individual layers for each feature type, to define colours, symbols and textures, to set and customize labels and to control layer visibility and zoom level.
Given the versatility of this software, the main steps of basemap design (in my experience) are as follows:
- Choose a good starting point – select which basemap you want to modify (language, data layers, etc.)
- Identify and develop your theme – what is your inspiration?
- Prepare the content of your basemap design – identify what changes you will make to the basemap to carry out your basemap design vision.
- Bring the icons, patterns and colours into the ArcGIS Vector Tile Style Editor – execute your basemap design vision.
- Use your basemap style! – access and use your basemap style across your maps and projects.
1. Choose a good starting point.
Choose a basemap from the available gallery that best suits your basemapping needs. Many templates already exist, ranging from basic global topographic basemaps to creative basemap styles.
The Community Map of Canada, due to its authoritative and accurate community data sources and frequency of updates, would be an excellent starting point for Canadian GIS users looking to customize basemaps. Unfortunately, the Community Map of Canada is not currently automatically accessible within the ArcGIS Vector Tile Style Editor, so I use a bit of a hacky DIY workaround also shared here – but hey, it works!
Using the Community Map in the VTSE: I go to the Community Map of Canada Topographic basemap and view it in Map Viewer Classic. Then, I use the “Change style” icon of three shapes below each basemap layer on the left panel to open up the Vector Tile Style Editor pop-up window. You can either make all your changes there for each layer or save it as another style and then access it in the Vector Tile Style Editor separately once saved.
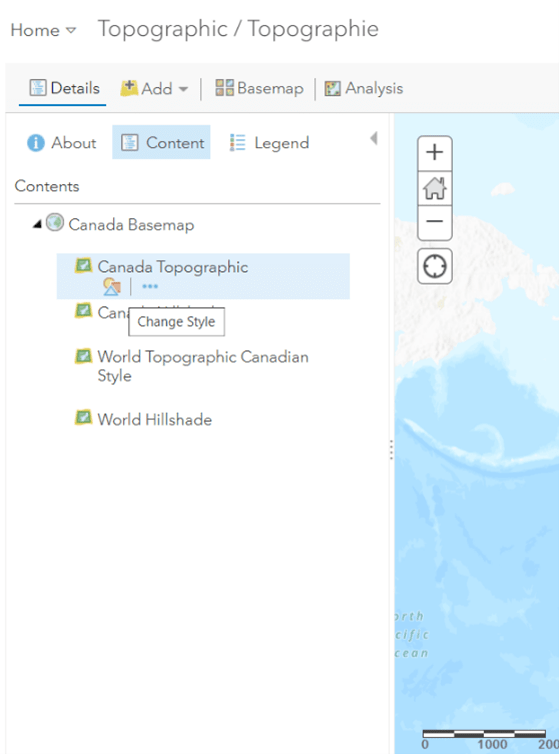
Open the Vector Tile Style Editor window by clicking on the “Change Style” shapes icon in Map Viewer Classic.
2. Identify and develop your theme.
To begin your journey as a budding cartographer-artist, you’ll want to get an idea of what your design inspiration is. Inspired by the artwork of French artist Paul Cézanne I’d seen at art museums in New York City and Chicago (below), I opted to design a basemap style that resembled his paintings and which would evoke his artistic flair (and this type of more ornate and artistic basemap design could be useful to accompany a StoryMap or web app about art and museums, for example). In developing my theme, I knew I wanted to take note of his colour palette and maybe even make use of some of his brush strokes to use as my polygon fill symbology.
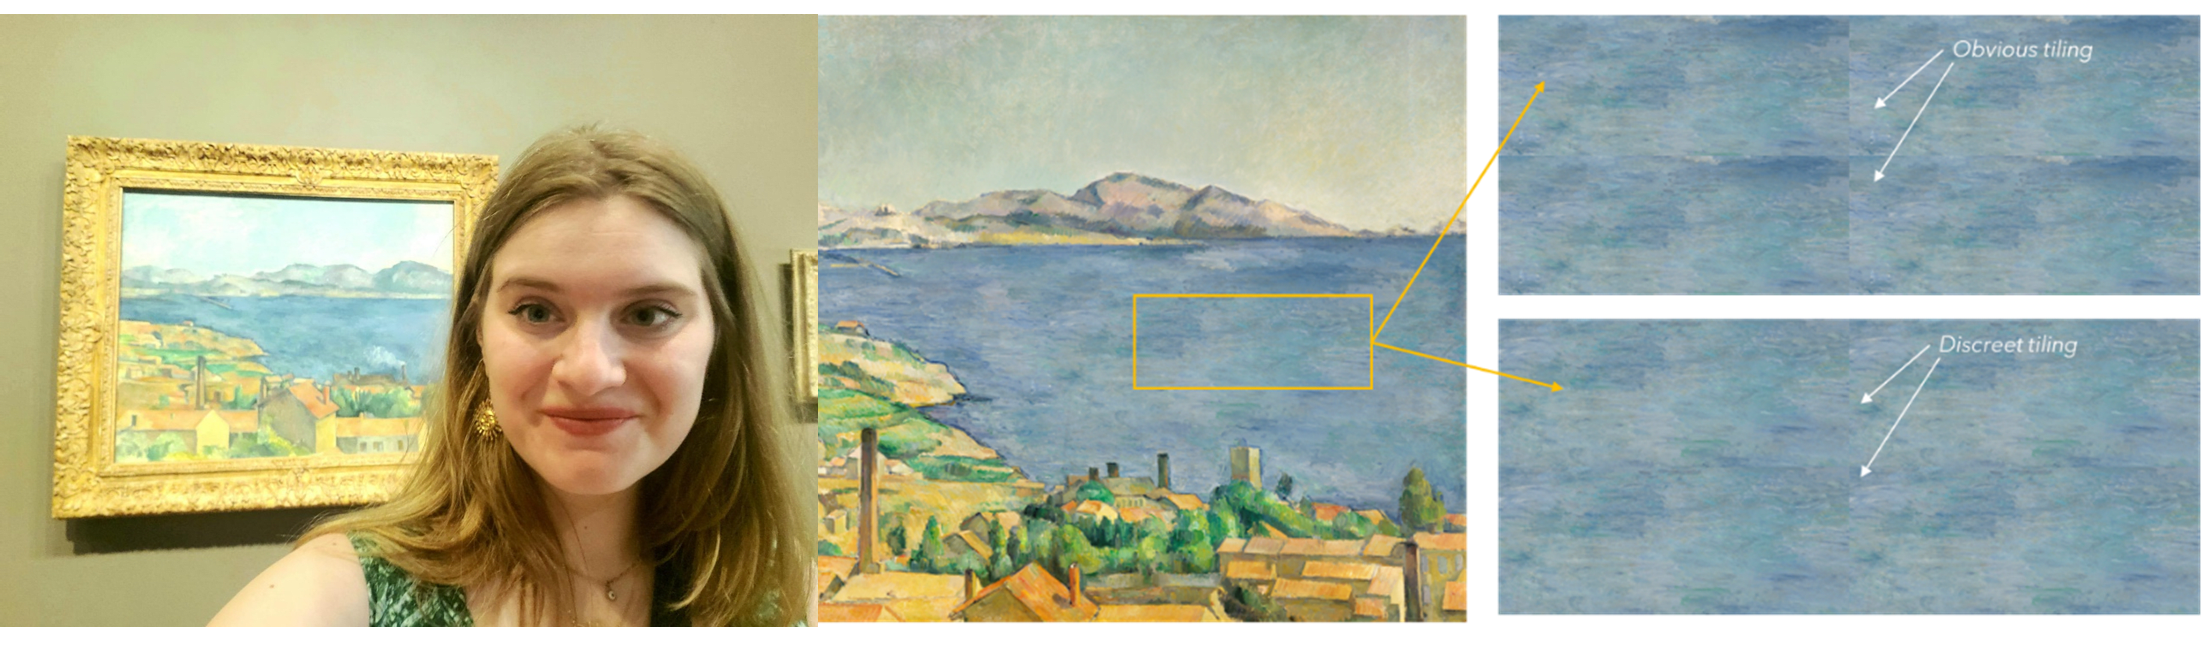 Left: Photo with an original Cézanne landscape, taken while visiting the Chicago Art Institute in May 2024. Middle and right: Screenshots showing using Cézanne’s brushstrokes from a similar painting and matching up the image so that it would make a good pattern to use in the basemap tiling.
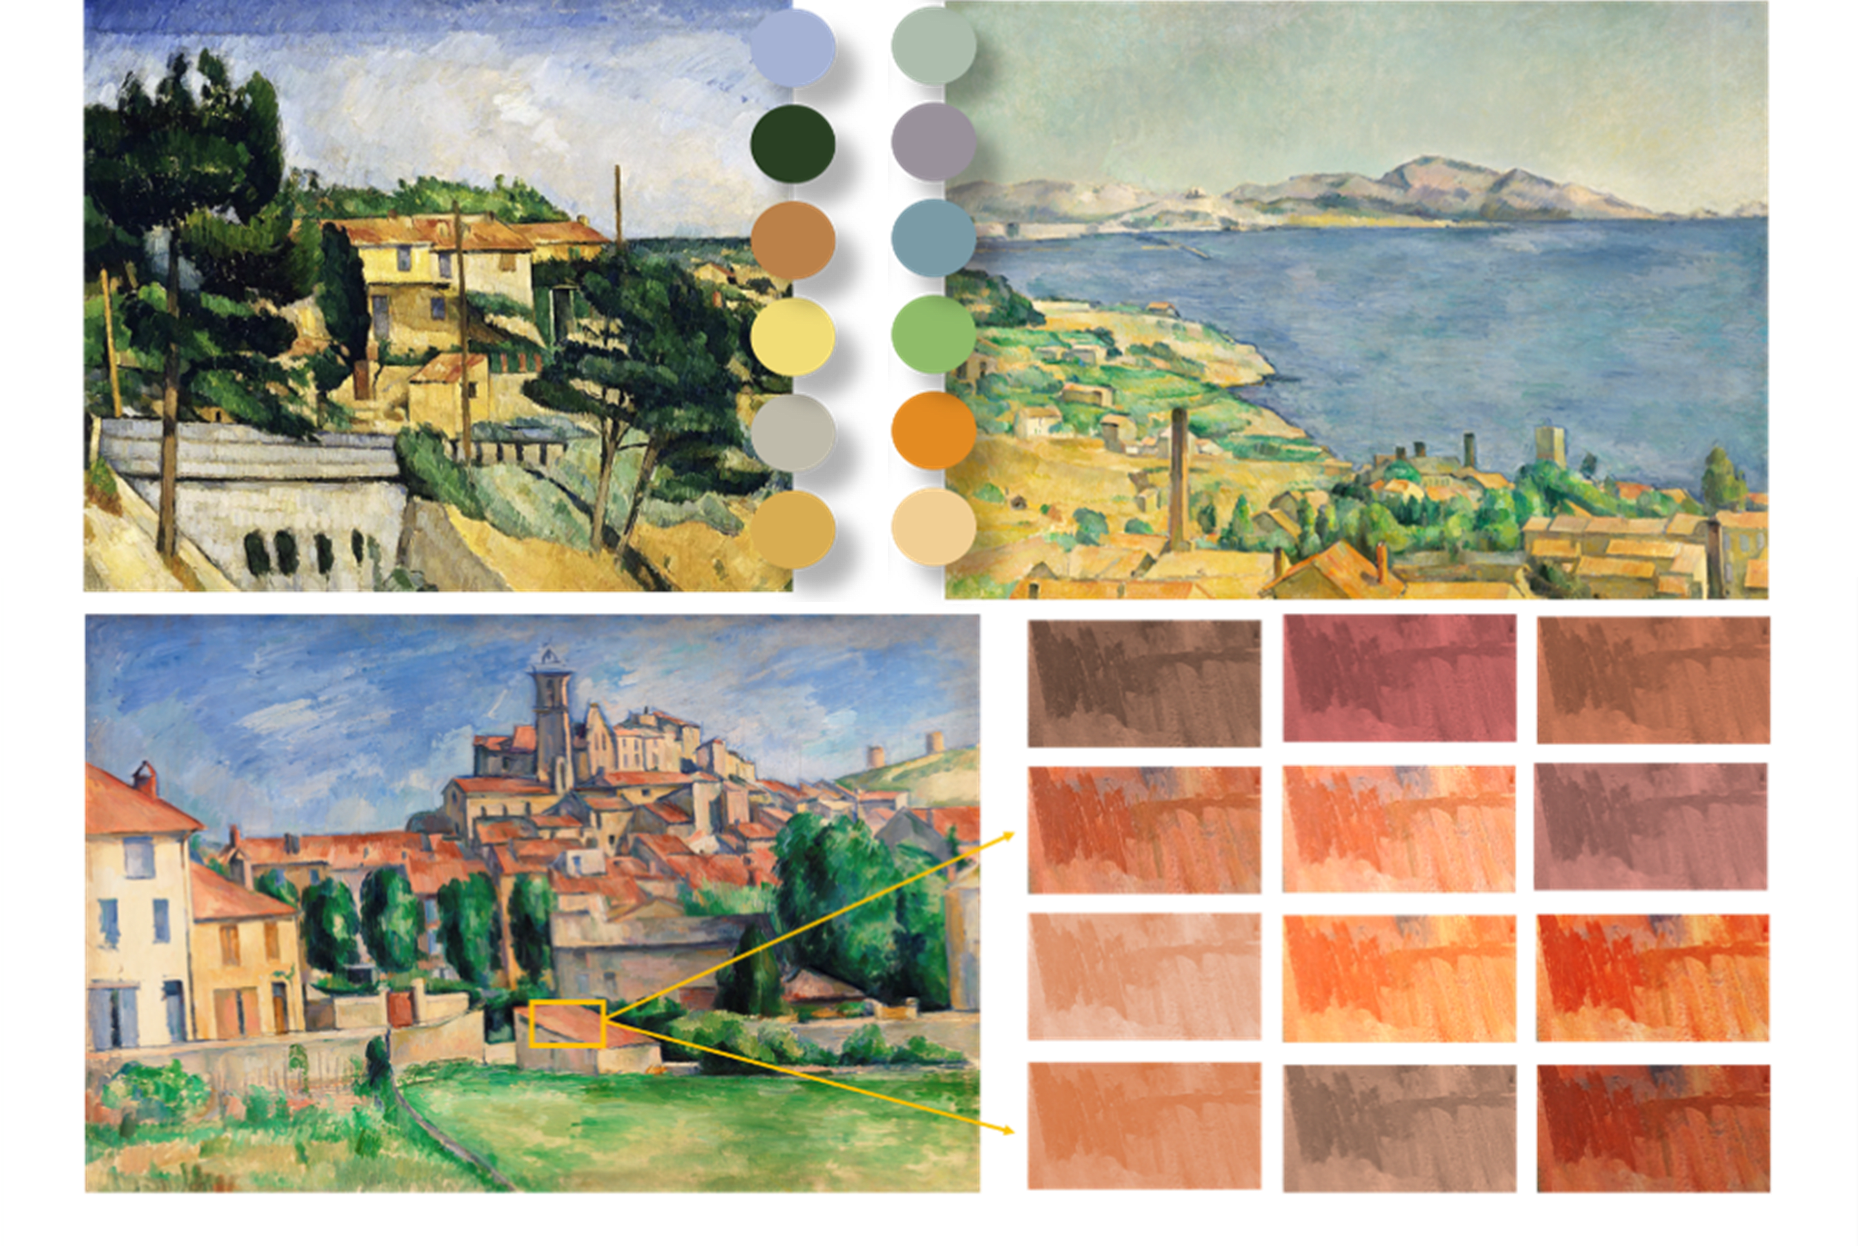
Photos showing the extraction of colours and patterns from Cézanne’s paintings. Applying tints to symbols can also be used to symbolize different building types (commercial vs educational building roofs, for instance).
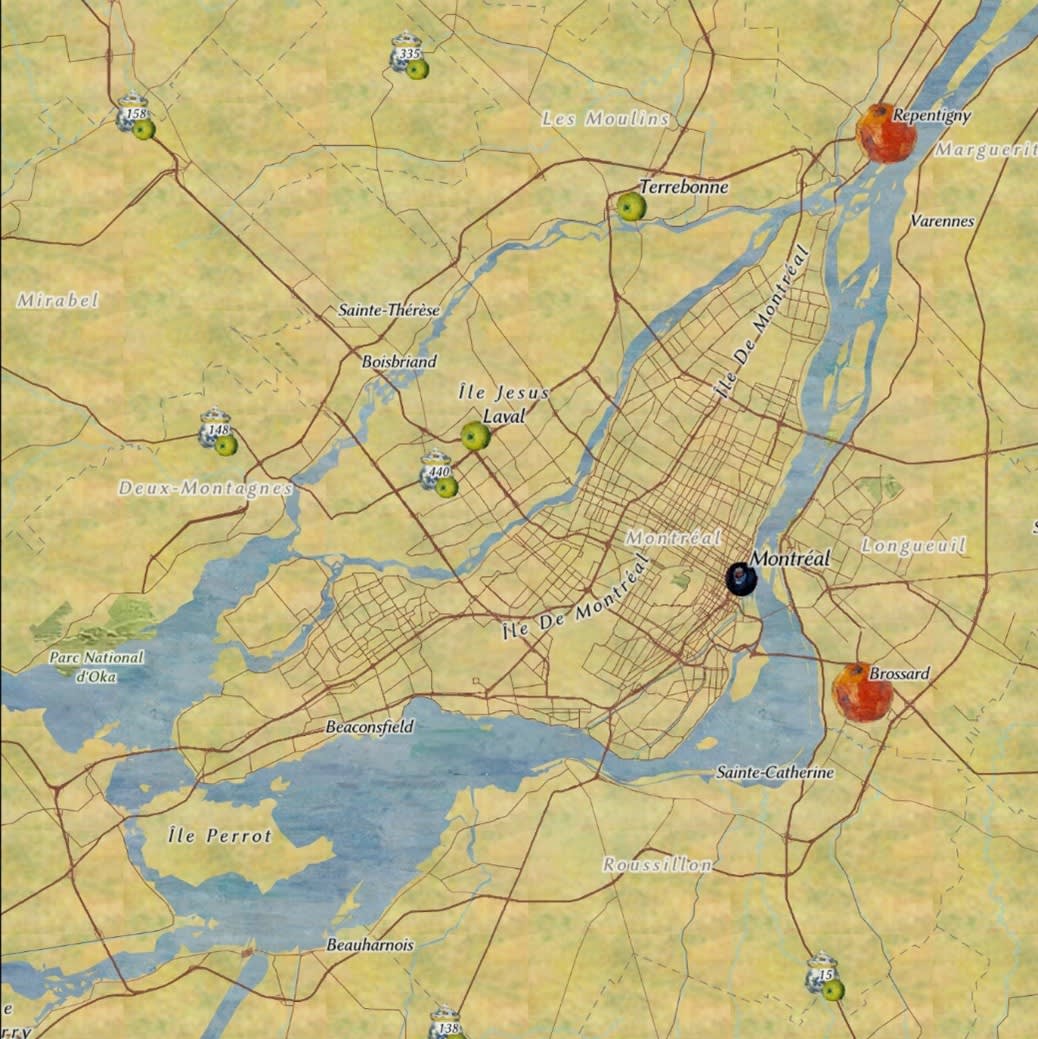
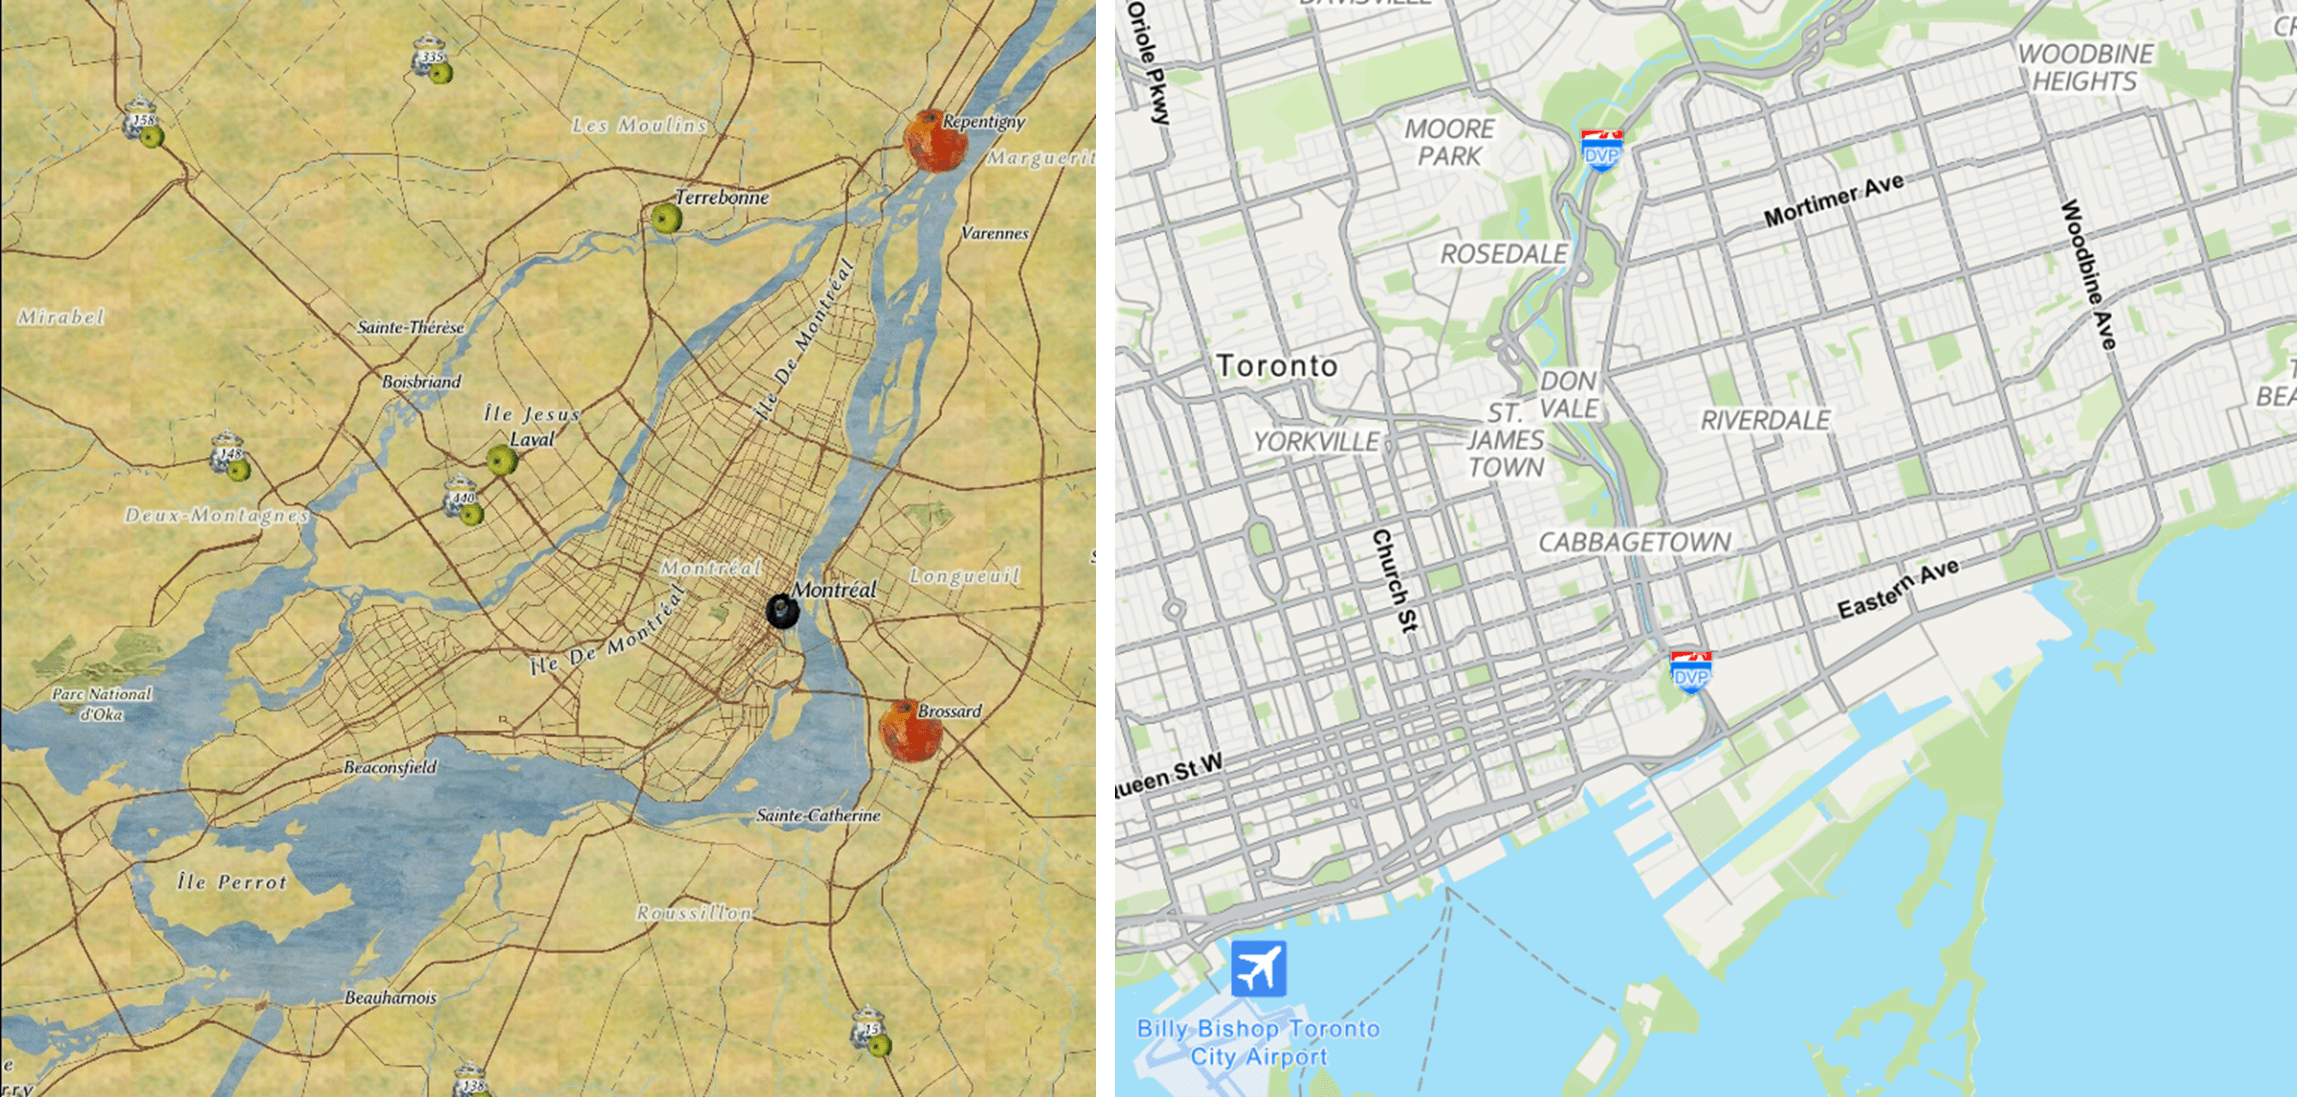
Photo showing the Community Map of Canada in Montréal, Québec, styled à la Paul Cézanne.
If you’re creating an Apple Maps-inspired design style, avoid Cézanne’s fruity Mediterranean maximalism and opt for the sleek California tech minimal look instead. During our collaboration with Geneviève Corneau from the Ville de Westmount, Québec, we decided that we liked the crisp look and feel of Apple Maps while also wanting to preserve the community data source and accuracy of the Community Map of Canada. So we set out to design a custom basemap design that would use those clean web map design principles, colours, and aesthetics and which would suit their taste.
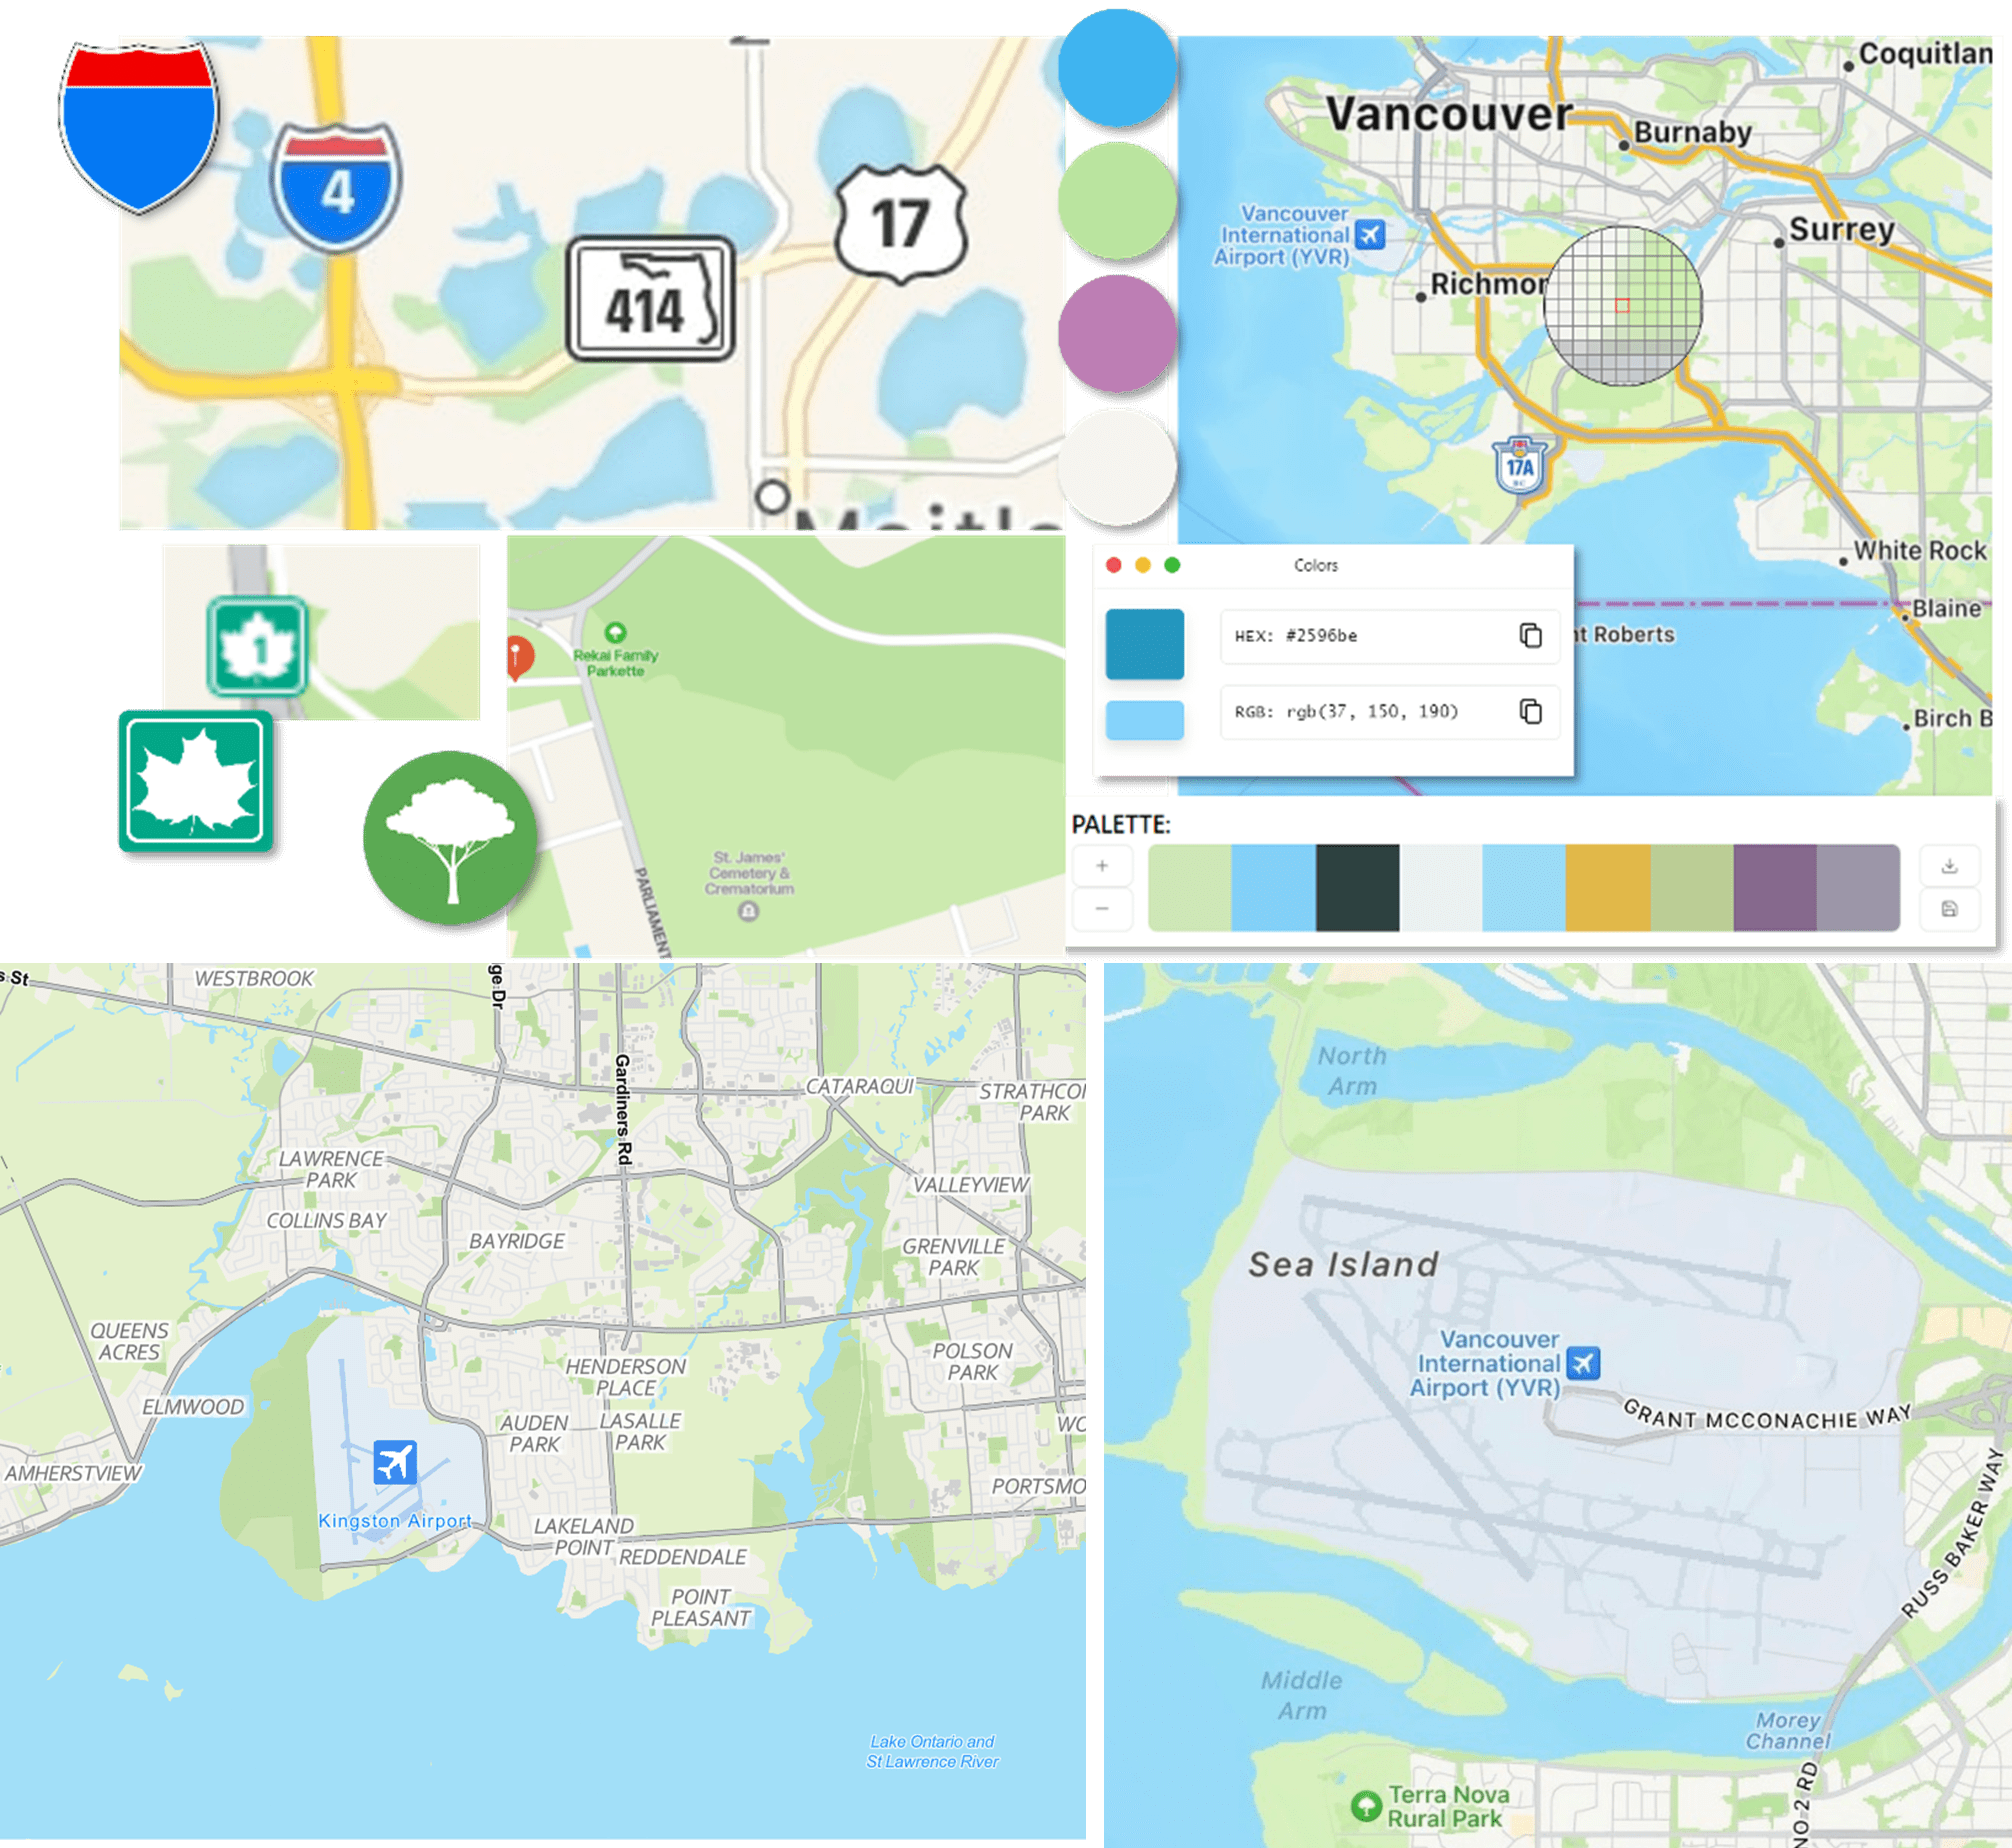
Top: The Community Map of Canada styled to look like the Apple Maps basemap (customized Community Maps on left, original Apple Maps inspiration photo on right). Bottom: Drawing inspiration from Apple Maps symbology by creating similar versions of the icons in Canva and by extracting colours from the colour palettes.
3. Prepare the content of your basemap design – identify what changes you will make to the basemap to carry out your basemap design vision.
Consider what symbols and colours to use for the cities, trees and highway shields in your map. The style of symbols you choose can really make or break your style! Think about what line weight, transparency, blur and dashes you might want to use for outlines, road polylines and borders. With the ArcGIS Vector Tile Style Editor, you can customize all these data layers and symbology attributes at a very granular level – it’s amazing! Decide which fonts, formats (Italics, bold, etc.) and halos you might want to use to achieve emphasis and clarity across your map. Save all the files (as PNGs) in organized folders and set aside your HEX colour codes and chosen feature symbology parameters in a word document or text file for future reference.
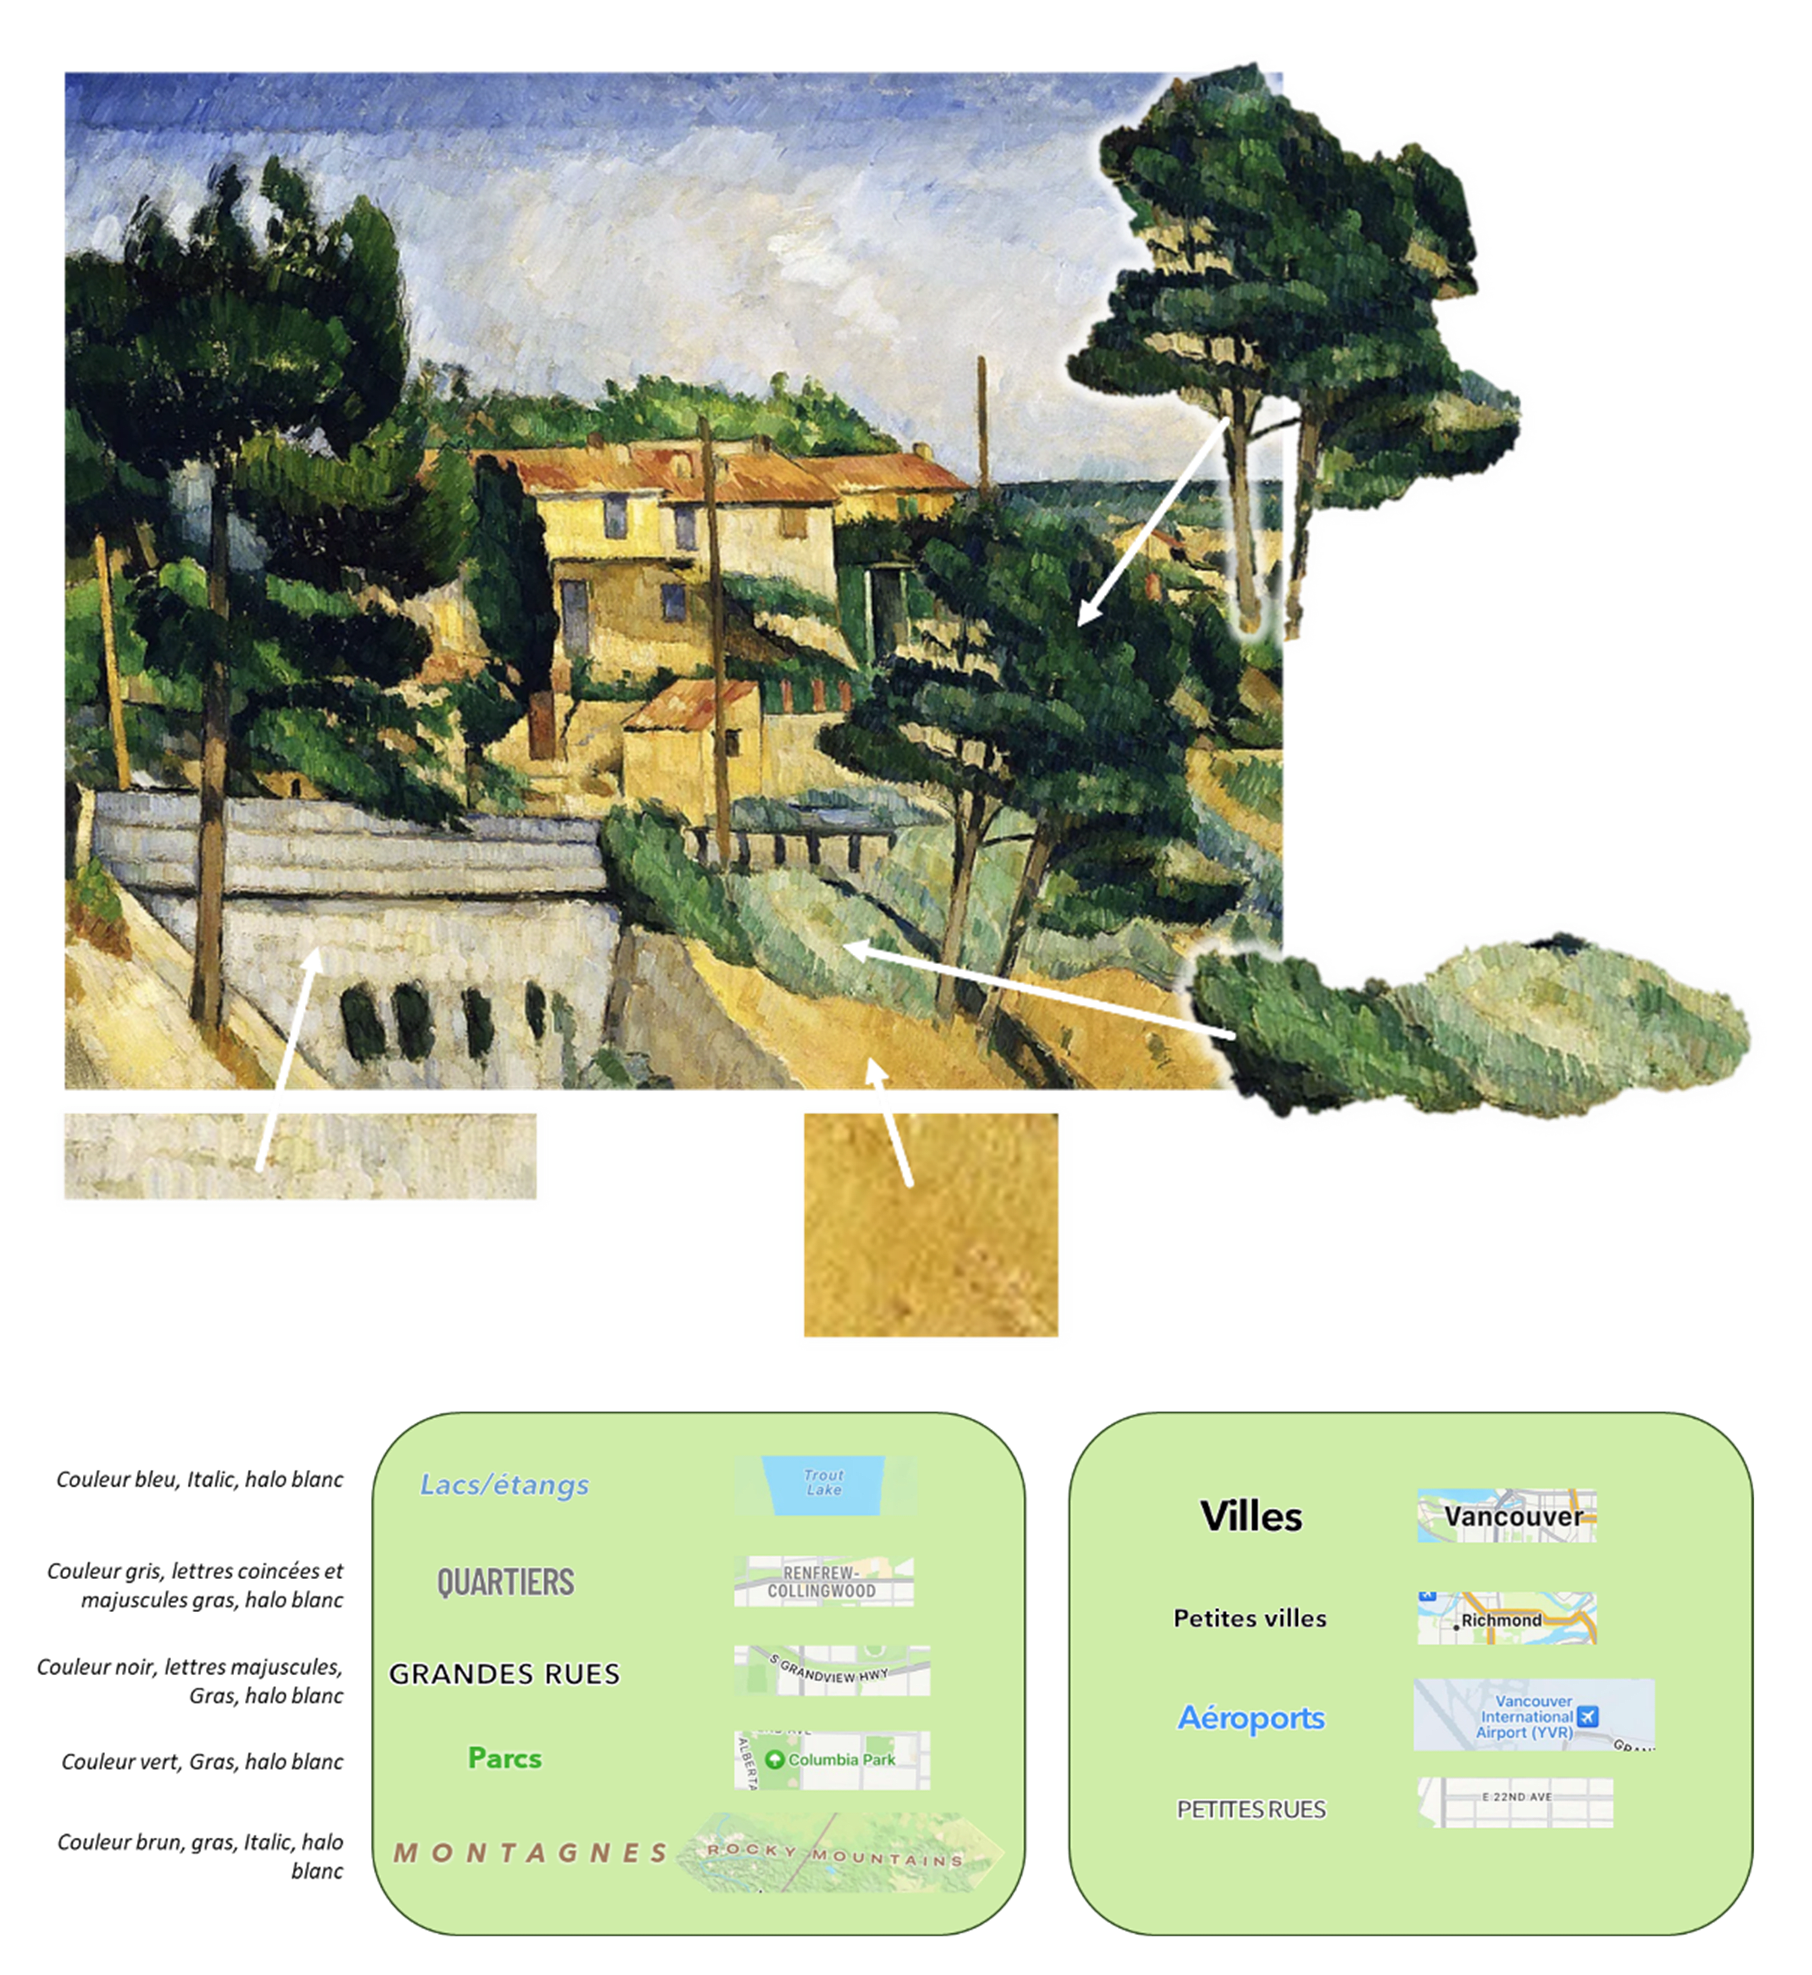
Top: Extracting icons for trees and shrubs and patterns for soil and concrete from a Cézanne painting. Bottom: Taking inspiration from Apple Maps labelling and preparing the ArcGIS interpretation of each label type for different feature (e.g. differences in font, boldness, case, size, halo, spacing, etc. to differentiate between features like mountain ranges, airports, neighbourhoods, small and large cities, etc.).
When planning your colour palette, drawing on your design inspiration or your existing mapping project, look at the main and complementary colours of your project. Do they go well together and meet visual accessibility requirements? (If not, there are many resources online to help you choose and check that your colours have an adequately high contrast ratio.) (See the “Tips and Tricks” section in Part 3 of this blog series for more tips and GIS resources on accessibility.)
4. Bring the icons, patterns and colours into the ArcGIS Vector Tile Style Editor – execute your basemap design vision.
When opening the ArcGIS Vector Tile Style Editor, you can either edit an existing style, a default out-of-the-box basemap or can start a new custom style from scratch (including a vector tile basemap you have created yourself).
When in an editing session, you’ll notice a number of different panes and components:
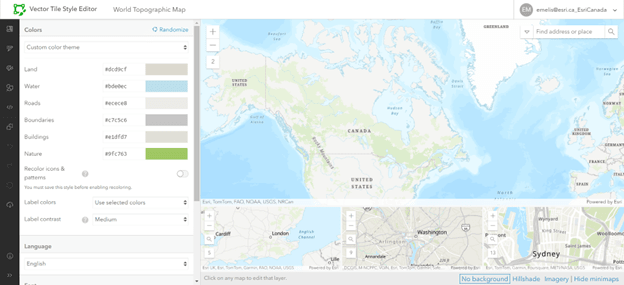
Screenshot of the Vector Tile Style Editor interface. This includes a main map, minimaps and editing pane on the left side.
- A main map pane in the centre that shows the basemap you are editing. See the map’s zoom scale and control buttons in the top left of the map pane.
- A panel of minimaps in the bottom pane show the map at different extents. Set the minimaps to different scales and extents (e.g. zoomed to building, neighbourhood and provincial levels) to see how the symbology looks as you make changes. This will save you time zooming and panning to check the new appearance at multiple scales. You can also hide the minimaps to clear up your workspace.
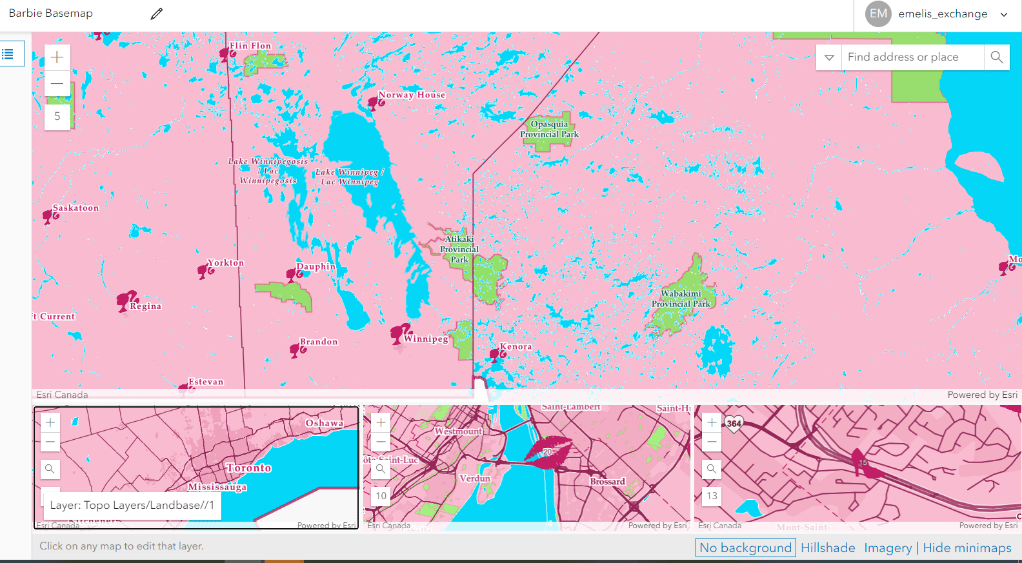
The main editing map pane and minimaps of the ArcGIS Vector Tile Style Editor.
- Use your cursor to mouse over a feature in the map and identify the layer. The layer name appears in the bottom left of the map pane. Click on the feature to open it up in the symbology editing pane on the left.
- The pane on the left can be expanded and used to navigate through various editing tabs:
-
- he Quick Edit tab allows you to edit and style in many layers at once.
- The Edit Layer Styles tab is where you can access all layers and the editing pane. Search for layers or sort them by drawing order or by category.
- The Edit by Colour tab allows you to make changes to all features using one colour at once – this can be helpful if you want to eliminate any stray colours (e.g. a bright red colour when you want the map to contain just a cool grey palette).
- The Edit Icons and Patterns tab is where you can access, edit, add and download all pattern and icon features. Adding files to this library of icons allows you to select them to symbolize features in the Edit Layer Styles tab (below).
- The Download as JSON tab allows you to access and customize the JSON code of the basemap style. This can allow for more flexibility in styling.
- And then of course there are other typical other buttons found along the bottom of the left pane: Duplicate, Download, Save, Save as, Undo, Redo, Reset, Information and so on.
The layer editing pane of the ArcGIS Vector Tile Style Editor.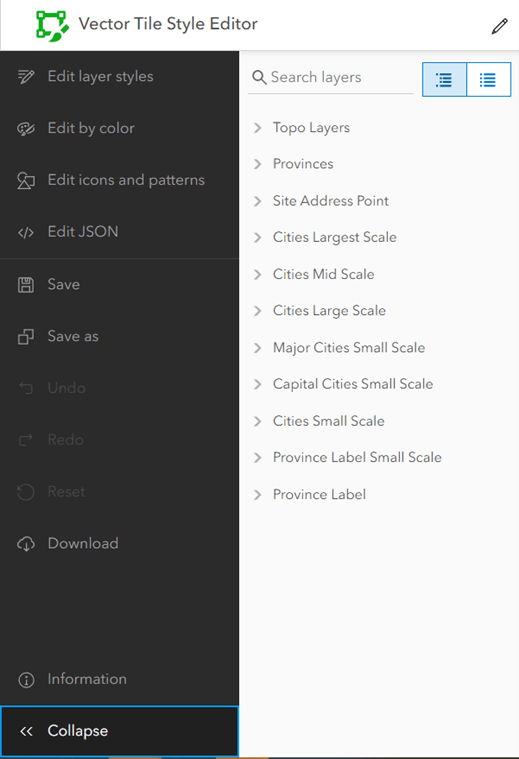
5. Use your basemap style! – access and use your basemap style across your maps and projects.
To access and use your basemap style across the ArcGIS system, simply save it and search for it in the catalog of wherever you are creating your maps and apps – ArcGIS Online, ArcGIS Pro, ArcGIS Enterprise; you name it! You can also share the basemap as a web map, use it with various basemap reference layers and of course overlay other vector data atop it.
Access and use your created basemap style in ArcGIS Pro by searching for it in the catalog and adding it to the map.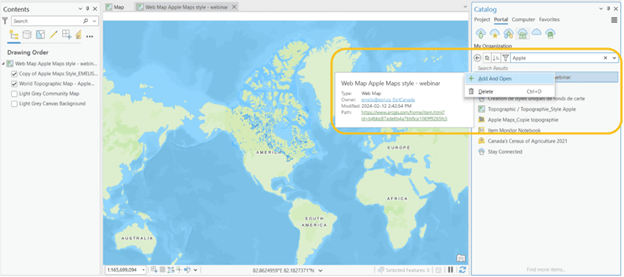
For more tips and tricks on designing custom basemaps and to read answers to commonly asked questions, navigate to the third and final article in this blog series.
-