What Makes a Place Runnable?
What makes a place feel good to run in? For Stella Harden, a Geography PhD candidate at Simon Fraser University, that question opened the door to a creative research project combining GIS, social media data, and sentiment analysis. Her award-winning paper at the SKI conference explores how runners describe their experiences across Metro Vancouver—and how those emotions can be mapped to reveal patterns in environment, accessibility, and gendered experience.
I recently attended the Spatial Knowledge and Information (SKI) Canada 2026 conference in Banff, Alberta, representing Esri Canada, the conference sponsor. It was a great opportunity to connect with members of the Canadian GIS community and hear about the wide range of research being presented. Events like SKI, as well as the Esri Canada User Conference and the GIS in Education and Research Conference in Toronto, are valuable spaces for building connections, exchanging ideas, and staying engaged with the broader GIS community. One student presentation at the SKI conference that especially stood out to me was Stella Harden’s. I was drawn to how thoughtfully she combined GIS, social media data, and qualitative analysis to explore runner experience in a new way. After her presentation, I had the chance to speak with Stella about her background, her research, and what comes next.
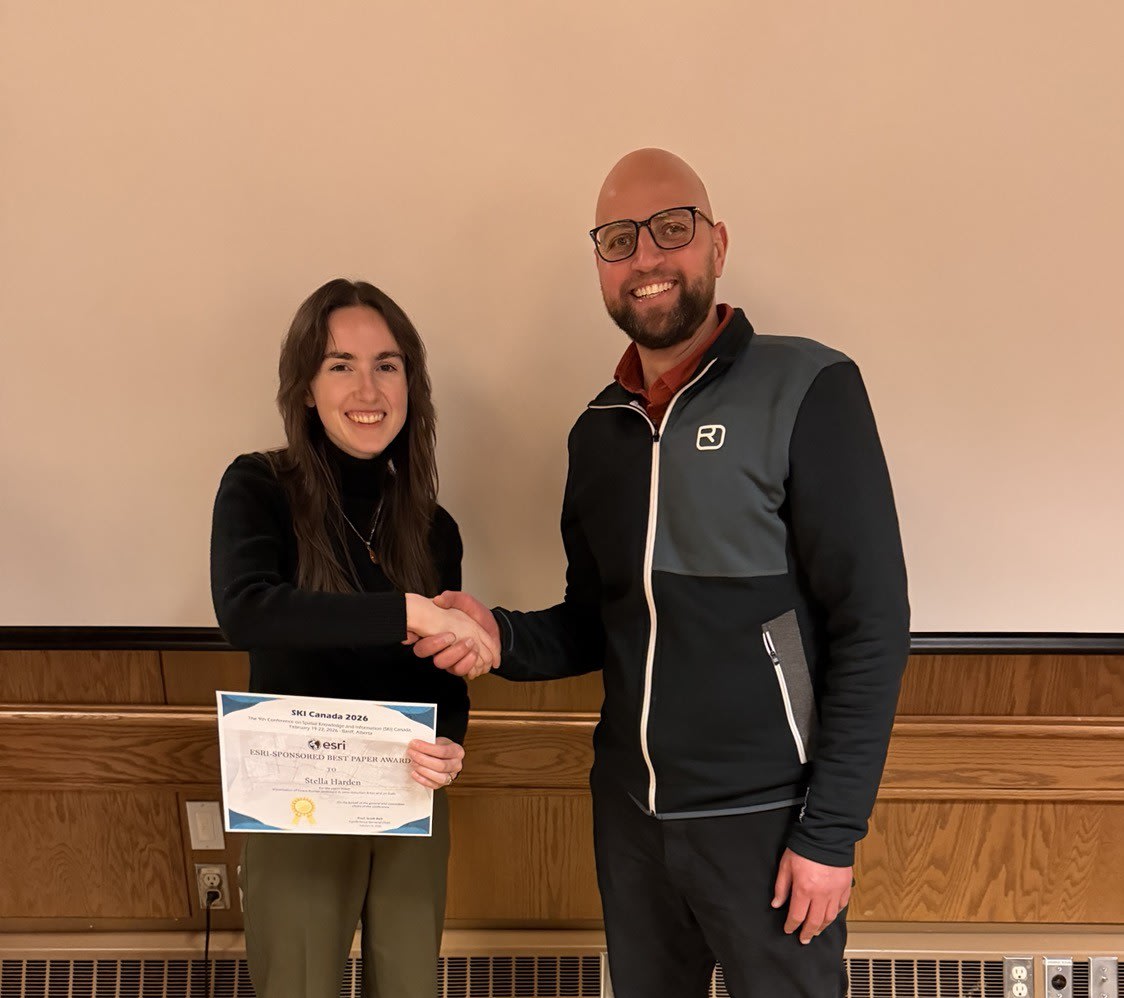
Stella Harden receiving the Esri Canada Best Paper Award at the SKI Canada 2026 conference in Banff, Alberta.
Thank you for joining, and congratulations on winning the Esri Canada Best Paper Award at the conference. To start, could you introduce yourself and share a bit about your academic background, including your program, institution, and research area?
My name is Stella Harden, and I am a Geography PhD candidate at Simon Fraser University working with Dr. Nadine Schuurman. My academic background is primarily in health geography and GIScience. Currently, I research runnability, which is the conduciveness of an environment to support running. With support from Strava Metro, I have been able to identify factors related to runner experience and the accessibility of runnable environments.

Stella stands along Vancouver’s waterfront.
What is the focus of your award-winning paper, and how would you describe it to someone outside your field?
The paper presents a novel approach to analysing the qualitative aspects of large crowdsourced datasets within a spatial context. Over 300 runners who use Strava, a social media platform for fitness tracking, were recruited to participate in the study by sharing their entire profile information via QR code. Most runners recorded activities in Metro Vancouver, and this paper focused on suburban areas and trails in the study area. Shared information included every run recorded over ten years, each with its own description logged by runners immediately after exercising. We were interested in measuring and visualizing the sentiment, or emotion, conveyed during each activity.
A sentiment analysis tool measured the degree of negativity and positivity expressed during each run, assigning values between -1 and +1. Using ArcGIS Pro, these values were then linked to each run trajectory (>40,000) and visualized by summarizing the data into 200-metre hexagonal bins. Next, we visualized rates of highly polarized (very negative or positive) runs for men and women. We then identified clustered areas with high rates of more extreme sentiment. Finally, we conducted an informal qualitative content analysis of the run descriptions falling within a cluster. In the content analysis, we were able to uncover the most common topics being discussed in an area (e.g., crowded trails, wildlife encounters). Ultimately, this allowed us to see how runners experience spatial variation by gender and uncover themes associated with positive and negative runs.
What inspired you to pursue this research topic? Was there a particular problem, experience, or question that motivated you?
Usually, Strava data are analysed quantitatively by using aggregated runner data to infer environmental correlations based on run volume. Motivated by the need for more qualitative engagement, we decided to uncover themes expressed directly by runners based on how they perceived their environment and what features caught their attention. We also wanted to demonstrate how large, crowdsourced datasets can be visualized qualitatively, going against the norm for most Strava research. At the same time, we were able to precisely locate areas with extreme sentiment and identify the factors contributing to polarized experiences in Metro Vancouver.
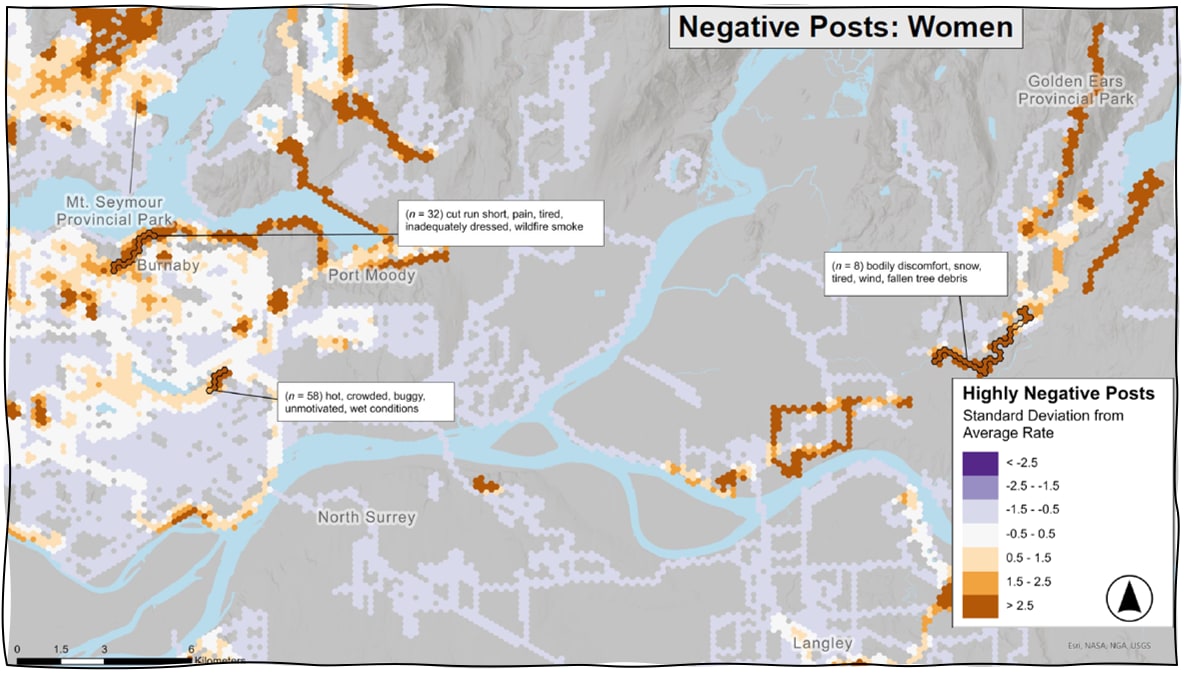
Map from Stella Harden’s research showing the spatial distribution of highly negative posts by women runners across the Metro Vancouver study area.
What was one of the biggest challenges you faced during this research, and how did you work through it?
The biggest challenge was figuring out how to visualize the data. I tried several approaches, from mapping average area sentiment to using statistical cluster identification methods. The sentiment for most runs was relatively neutral, which influenced our decision to focus on runs that were markedly positive or negative based on their sentiment value. In the end, mapping the rates of very positive or negative runs compared to the total number of runs in an area was the most reliable way to represent this information. We ended up applying locally weighted averages as well to minimize potentially misleading outliers arising from areas with few runs.
How was your experience presenting at the conference, and what did winning this award mean to you?
Presenting at the SKI Conference helped boost my confidence. I was able to hear remarks from other members of the Canadian GIScience community, which will only bolster my future approaches to topics like the one in this paper. Numerous students presented methods and shared resources I was unfamiliar with, and the collaborative atmosphere felt incredibly supportive.
Winning the best paper award was a great source of validation that I am on the right track in terms of how I want to engage with GIS. I was also pleased to see that this topic is interesting and valuable to other scholars as well.
Looking ahead, what are your next steps, and what advice would you give to other students starting out in GIScience research?
This study was my first foray into mixed methods GIScience. In the process of conducting research, many new ideas came to the surface. In the future, I am hoping to develop other creative avenues for applying qualitative paradigms to social media data.
My advice to other students would be to find a way to connect your interests with your research, and to be open to thinking outside the box. Engage with conversations that are happening in other disciplines, or outside of academia, and figure out how geospatial analysis can be used to add to the discourse.
Thank you, Stella, and all the best as you head into the final stretch of your PhD research.
Stella’s work was one of the many highlights that made this year’s SKI conference so rewarding to attend. What stood out to me was the way her project used GIS not only to map movement, but also to better understand human experience, perception, and place. It was a pleasure speaking with Stella and learning more about the thinking behind her work. Congratulations again to her on this well-deserved recognition, and I look forward to seeing where her research goes next. I’m already looking forward to SKI2028— and maybe next time I will bring my skis to match the name and make the most of beautiful Banff!