Coming in HOT: Resources to Keep You Informed this Wildfire Season
The 2025 wildfire season is here, and we want to make sure you have the resources you need to stay informed.
In fall of last year, it was announced that the 2024 wildfire season was on track to be the second largest in the past two decades. Drought played a major factor in the 2024 wildfires as the Weather Network stated that a combination of above-normal temperatures and lack of rain in parts of the country fueled fires.
Climate change is lengthening the fire season, with spring and autumn adding more high-severity burn days. Looking into the Spring forecast, meteorologists predict below-normal temperatures alongside average precipitation levels, which will hopefully be beneficial as western Canada saw below- seasonal amounts of precipitation this winter. This serves as a reminder of the urgent need for robust wildfire resources necessary for early detection, evacuation planning and raising community awareness – all of which can be achieved through The ArcGIS Living Atlas of the World.
The Living Atlas is the foremost collection of geographic information from around the world, it includes content from Esri, Esri Partners and the GIS user community. Esri Canada has produced and curated authoritative Canadian content that you can leverage to analyze natural disasters using both real-time and historical data to study the present and better prepare for the future.
Here are some essential wildfire and weather datasets in the Living Atlas to help you stay informed this wildfire season:

Update Frequency: Every 6 hours
This animated imagery service displays forecasted wildfire smoke in units of micrograms per meter cubed (µg/m3) for the next two days across Canada sourced from BlueSky Canada's FireSmoke app.
Update Frequency: Every 3 hours
This dataset displays active wildfire locations collected from fire management agencies (provinces, territories and Parks Canada) coordinated by the Canadian Interagency Forest Fire Centre (CIFFC) and Natural Resources Canada (NRCan).
**Important Notice** This item recently moved to a new ArcGIS Online account, to ensure you are using the correct item use the link above. If you are using the previous version of this item, please update to the new version as soon as possible to avoid any data disruptions, you can find more information on how to do so in this blog.
Update Frequency: Every 3 hours
This dataset displays active wildfire perimeters derived from hotspots identified in satellite imagery provided by the Canadian Wildland Fire Information System (CWFIS) and Natural Resources Canada (NRCan).
Update Frequency: Once a year in July
This dataset was sourced from the National Burned Area Composite (NBAC). It is a national, geospatial burned area product compiled annually since 1986 for annual estimates of carbon emissions. It is coordinated by the Canadian Wildland Fire Information System (CWFIS) and Natural Resources Canada (NRCan).
Update Frequency: Every 15 minutes
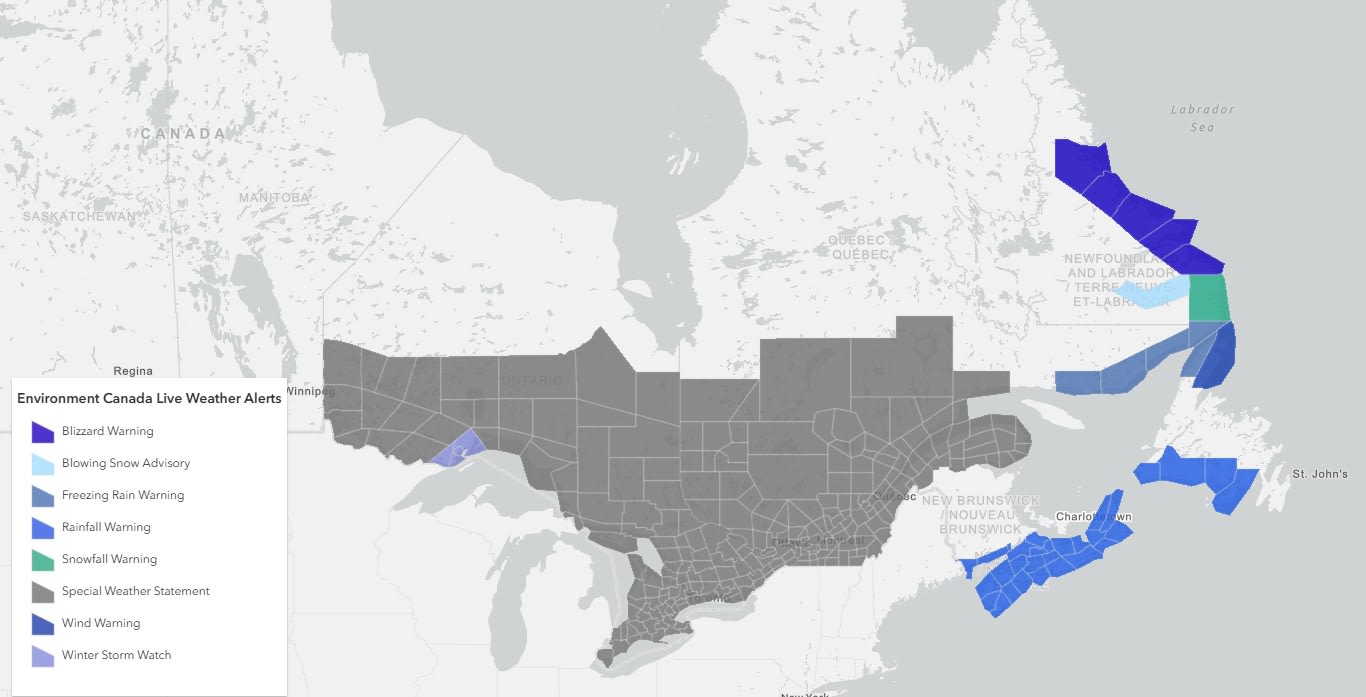
This dataset displays active public weather alerts issued by the Environment and Climate Change Canada (ECCC). Alerts are classified depending on the severity and timing of the subject event and include warnings, watches, advisories and statements. Warnings are usually issued six to 24 hours in advance, although some severe weather (such as thunderstorms and tornadoes) can occur rapidly, with less than a half hours’ notice.
The following datasets are apart of the Agroclimate Maps provided by Agriculture and Agri-Food Canada (AAFC).
Update Frequency: monthly
This animated imagery service displays the Palmer Drought Index (PDI) which is a measurement of dryness by evaluating recent precipitation and temperature, using a supply-and-demand model of soil moisture. This index has been used to assess various conditions including long-term drought, variations in soil moisture and other related factors.
Update Frequency: monthly
This time enabled imagery dataset displays data on dry spells across Canada over the past 10 years. Dry spells are defined as the number of consecutive days within the date range (April 1 to October 31, representing the growing season) during which daily precipitation was less than 0.5mm.

Update Frequency: monthly
This time enabled imagery dataset shows heat waves across Canada over the past 10 years. A heat wave is defined as the consecutive number of days (from April 1 to October 31, covering the growing season) where the maximum daily temperature in a region exceeds 25 or 30 degrees Celsius respectively.