Designing Community Basemaps with the ArcGIS Vector Tile Style Editor: Part 3
Basemaps don’t have to be basic or boring. You can design them to suit any creative theme you like, from mimicking minimal Apple basemaps to designing fruity maximalist maps using Paul Cézanne’s oil paintings. Check out this blog post for design tips, best practices and to find answers to the most commonly asked questions.
This is the third blog of a three-part blog series about designing custom community basemaps using the Community Map of Canada: The first blog discussed the endless possibilities of creative basemap design and the second blog involved a tutorial of the ArcGIS Vector Tile Style Editor and outlined the main steps of basemap design. This third blog in the series shares design tips and answers for some of the most commonly asked questions.
Tips and Tricks
I also wanted to share some more tips and best practices I have learned from my experience using the ArcGIS Vector Tile Style Editor.
1. Visual Accessibility of BasemapsWhen designing a basemap to be high contrast, consider opening your map in ArcGIS Pro and using the ArcGIS Pro Color Deficiency Simulator feature that allows you to simulate different visual abilities and ensure that you are making the correct choices in colour and pattern/texture.
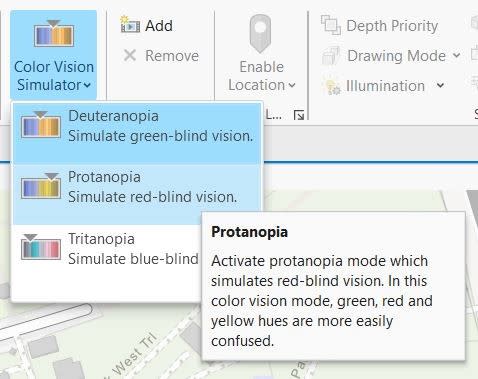
The Colour Vision Simulator tool from ArcGIS Pro. The simulator tool simulates for three vision and colour deficiency conditions: Deuteranopia, Protanopia and Tritanopia, all of which involve different levels of colour visibility.
You might also want to change the scale visibility of different features to ‘tidy up’ the appearance of your basemap and draw attention to select features, rather than overwhelming the user. This can be done by dragging or manually setting the visibility of the feature(s) in the left editing pane to be visible only at smaller scales or by removing the layer’s visibility entirely by increasing the feature’s transparency or toggling off its visibility.
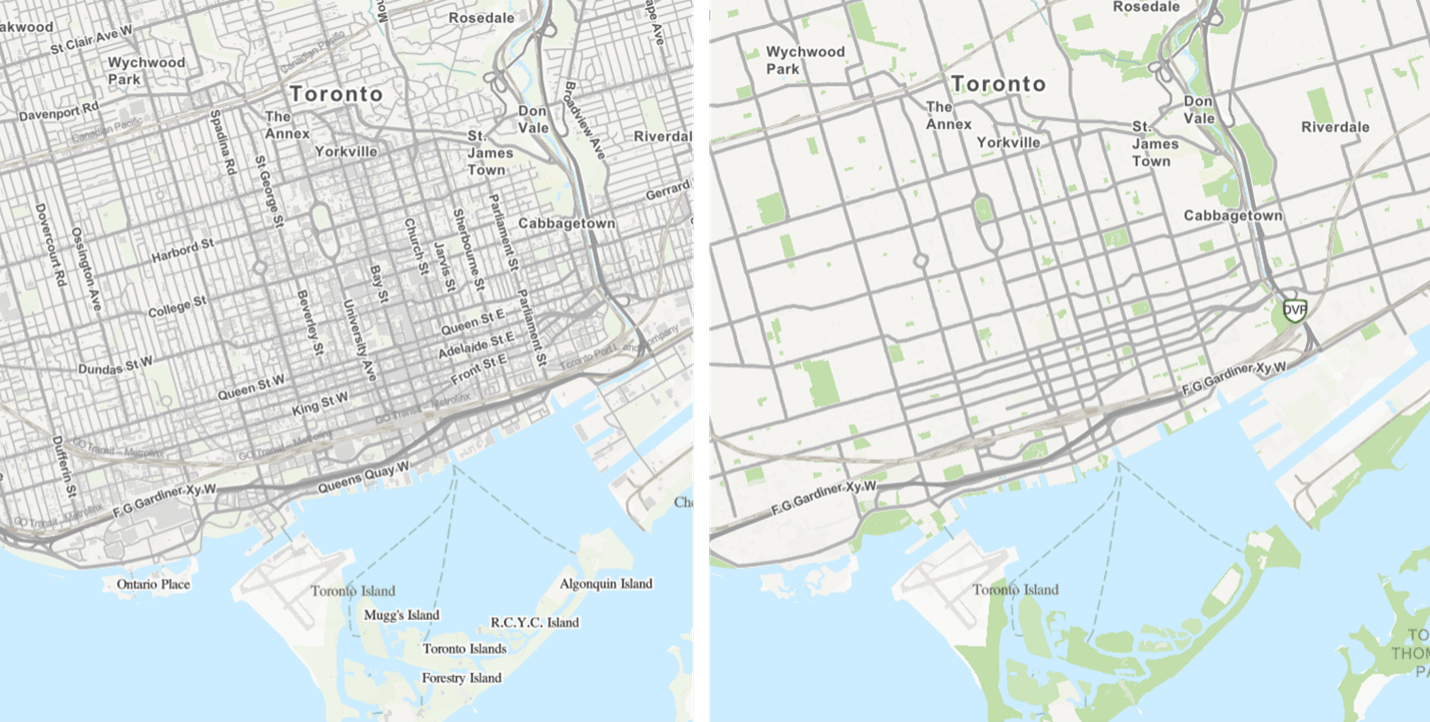
Both maps are the Community Map of Canada Topographic basemap, but the only differences are that some data layers at this scale have been removed and that the green colour of the parks has been increased. See how the map becomes instantly less busy.
There are many helpful resources sharing expertise on designing visually accessible maps, sharing main tips that include choosing a large sans-serif font, using high-contrast text and halo colours for labels, and using different colours and patterns to differentiate between polygon and polyline features that might be difficult to distinguish otherwise. These accessible basemap design principles were applied to the Community Map of Canada as part of the demo in the webinar led alongside my colleague Amanda Hunter. An official high-contrast version of the Community Map of Canada, akin to that demonstrated during the webinar, will be released later in 2024.
2. Edit Icons and Patterns
To customize feature symbols, access the Edit Icons and Patterns tab. In there, you can add new and delete existing icons and also add colour tints to icons, tile icon symbols as patterns (to create a tessellation), download the file directly and most importantly, replace the icon with another. This latter capability is helpful if you decide you want to change an icon but don’t want to manually change it in every feature currently using the old symbol.
![]()
How to add, replace, download, tile, and recolour icons and patterns in the ArcGIS Vector Tile Style Editor.
3. Change data in all layers at once under a categorySometimes you want to make the same change to multiple layers within a category (called ‘Bulk Editing’)– change the colour across all types of building polygons or parks or to alter the font for all feature labels – you can do so under the larger category. Other symbology elements (such as a feature’s transparency, icon, pattern or position) can only be edited under each independent layer. But if you want to change a certain symbology across all layers within the category, the Bulk Edit is the way to do so.
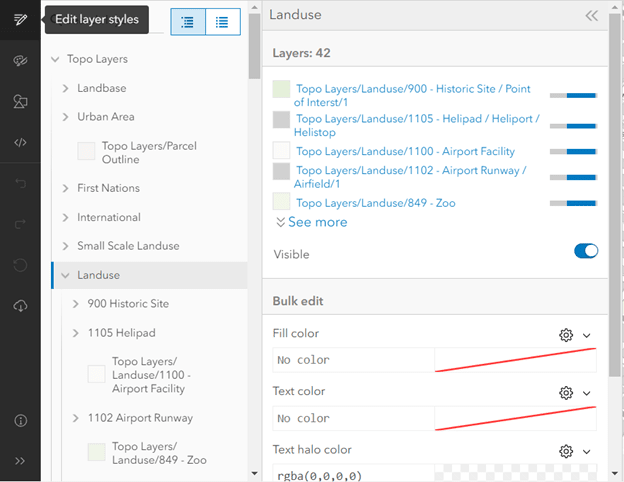
Editing layer styles (in bulk and layer by layer) in the Layer Editing Pane of the ArcGIS Vector Tile Style Editor.
4. Symbolize each country differently
If you ever want to create a basemap in which each country has a different color / symbology, use the "Charted Territory" basemap. This is the only way we’ve found to symbolize land within country’s borders rather than symbolizing all physical land masses at once.
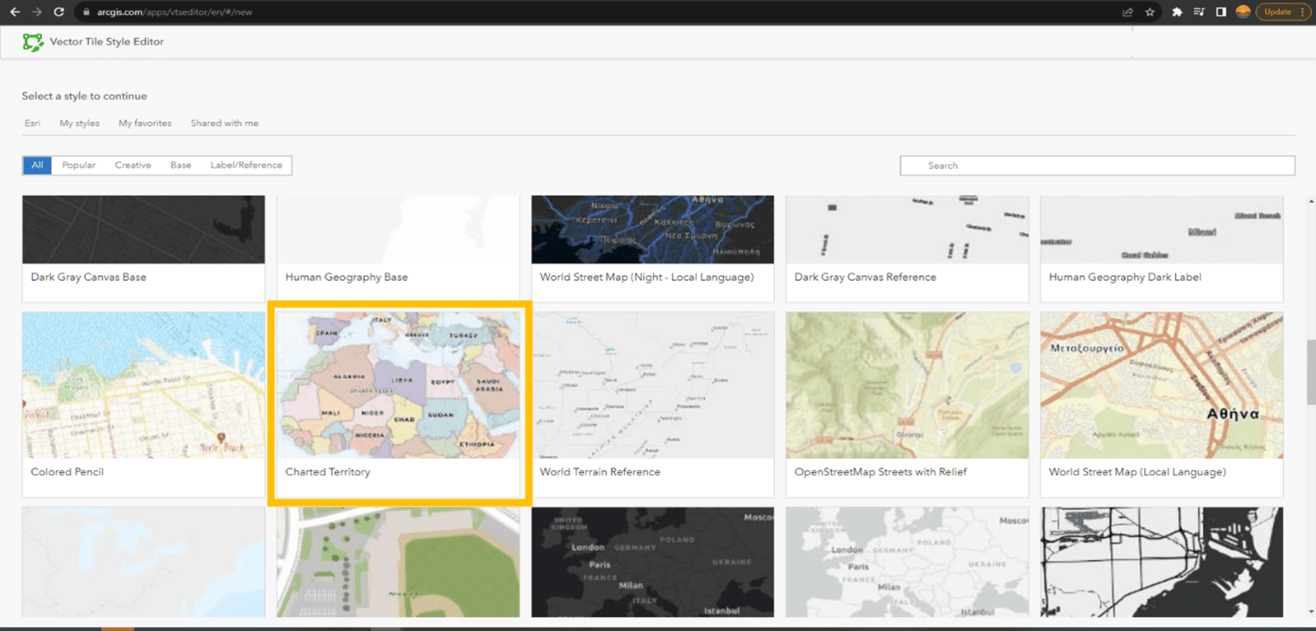
In the ArcGIS Vector Tile Style Editor, choose the "Charted Territory" basemap.
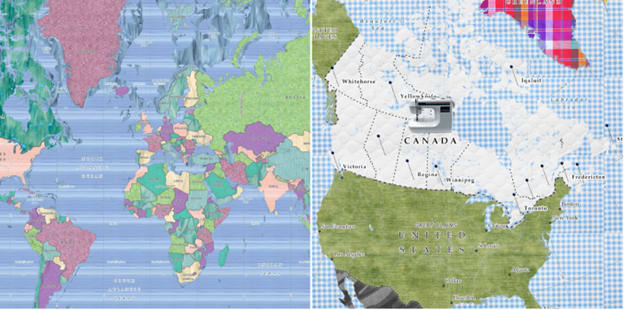
Using the "Charted Territory" basemap, countries can have unique symbologies. Here are two custom basemap styles for Canada's Community Map of the Month styles which both use the Charted Territory basemap for the world map to create a stained glass basemap effect and a patchwork quilt basemap design.
5. You want to hide some data layersWith basemaps, because the data layers are already ‘baked into’ the map, you can’t access, change or delete the underlying data in the Vector Tile Style Editor (the data would have to be changed by the source).
But what if you wanted to create web map or an application that showed a comparison between a city with trees versus without trees (below)? For the user experience of such an application, it would be better to have an interactive vector layer for the trees layer that can be checked and unchecked in the app. What we need to do in this realm of basemap design is to hide the visibility of these data layers by unchecking the visibility of the layer symbology.
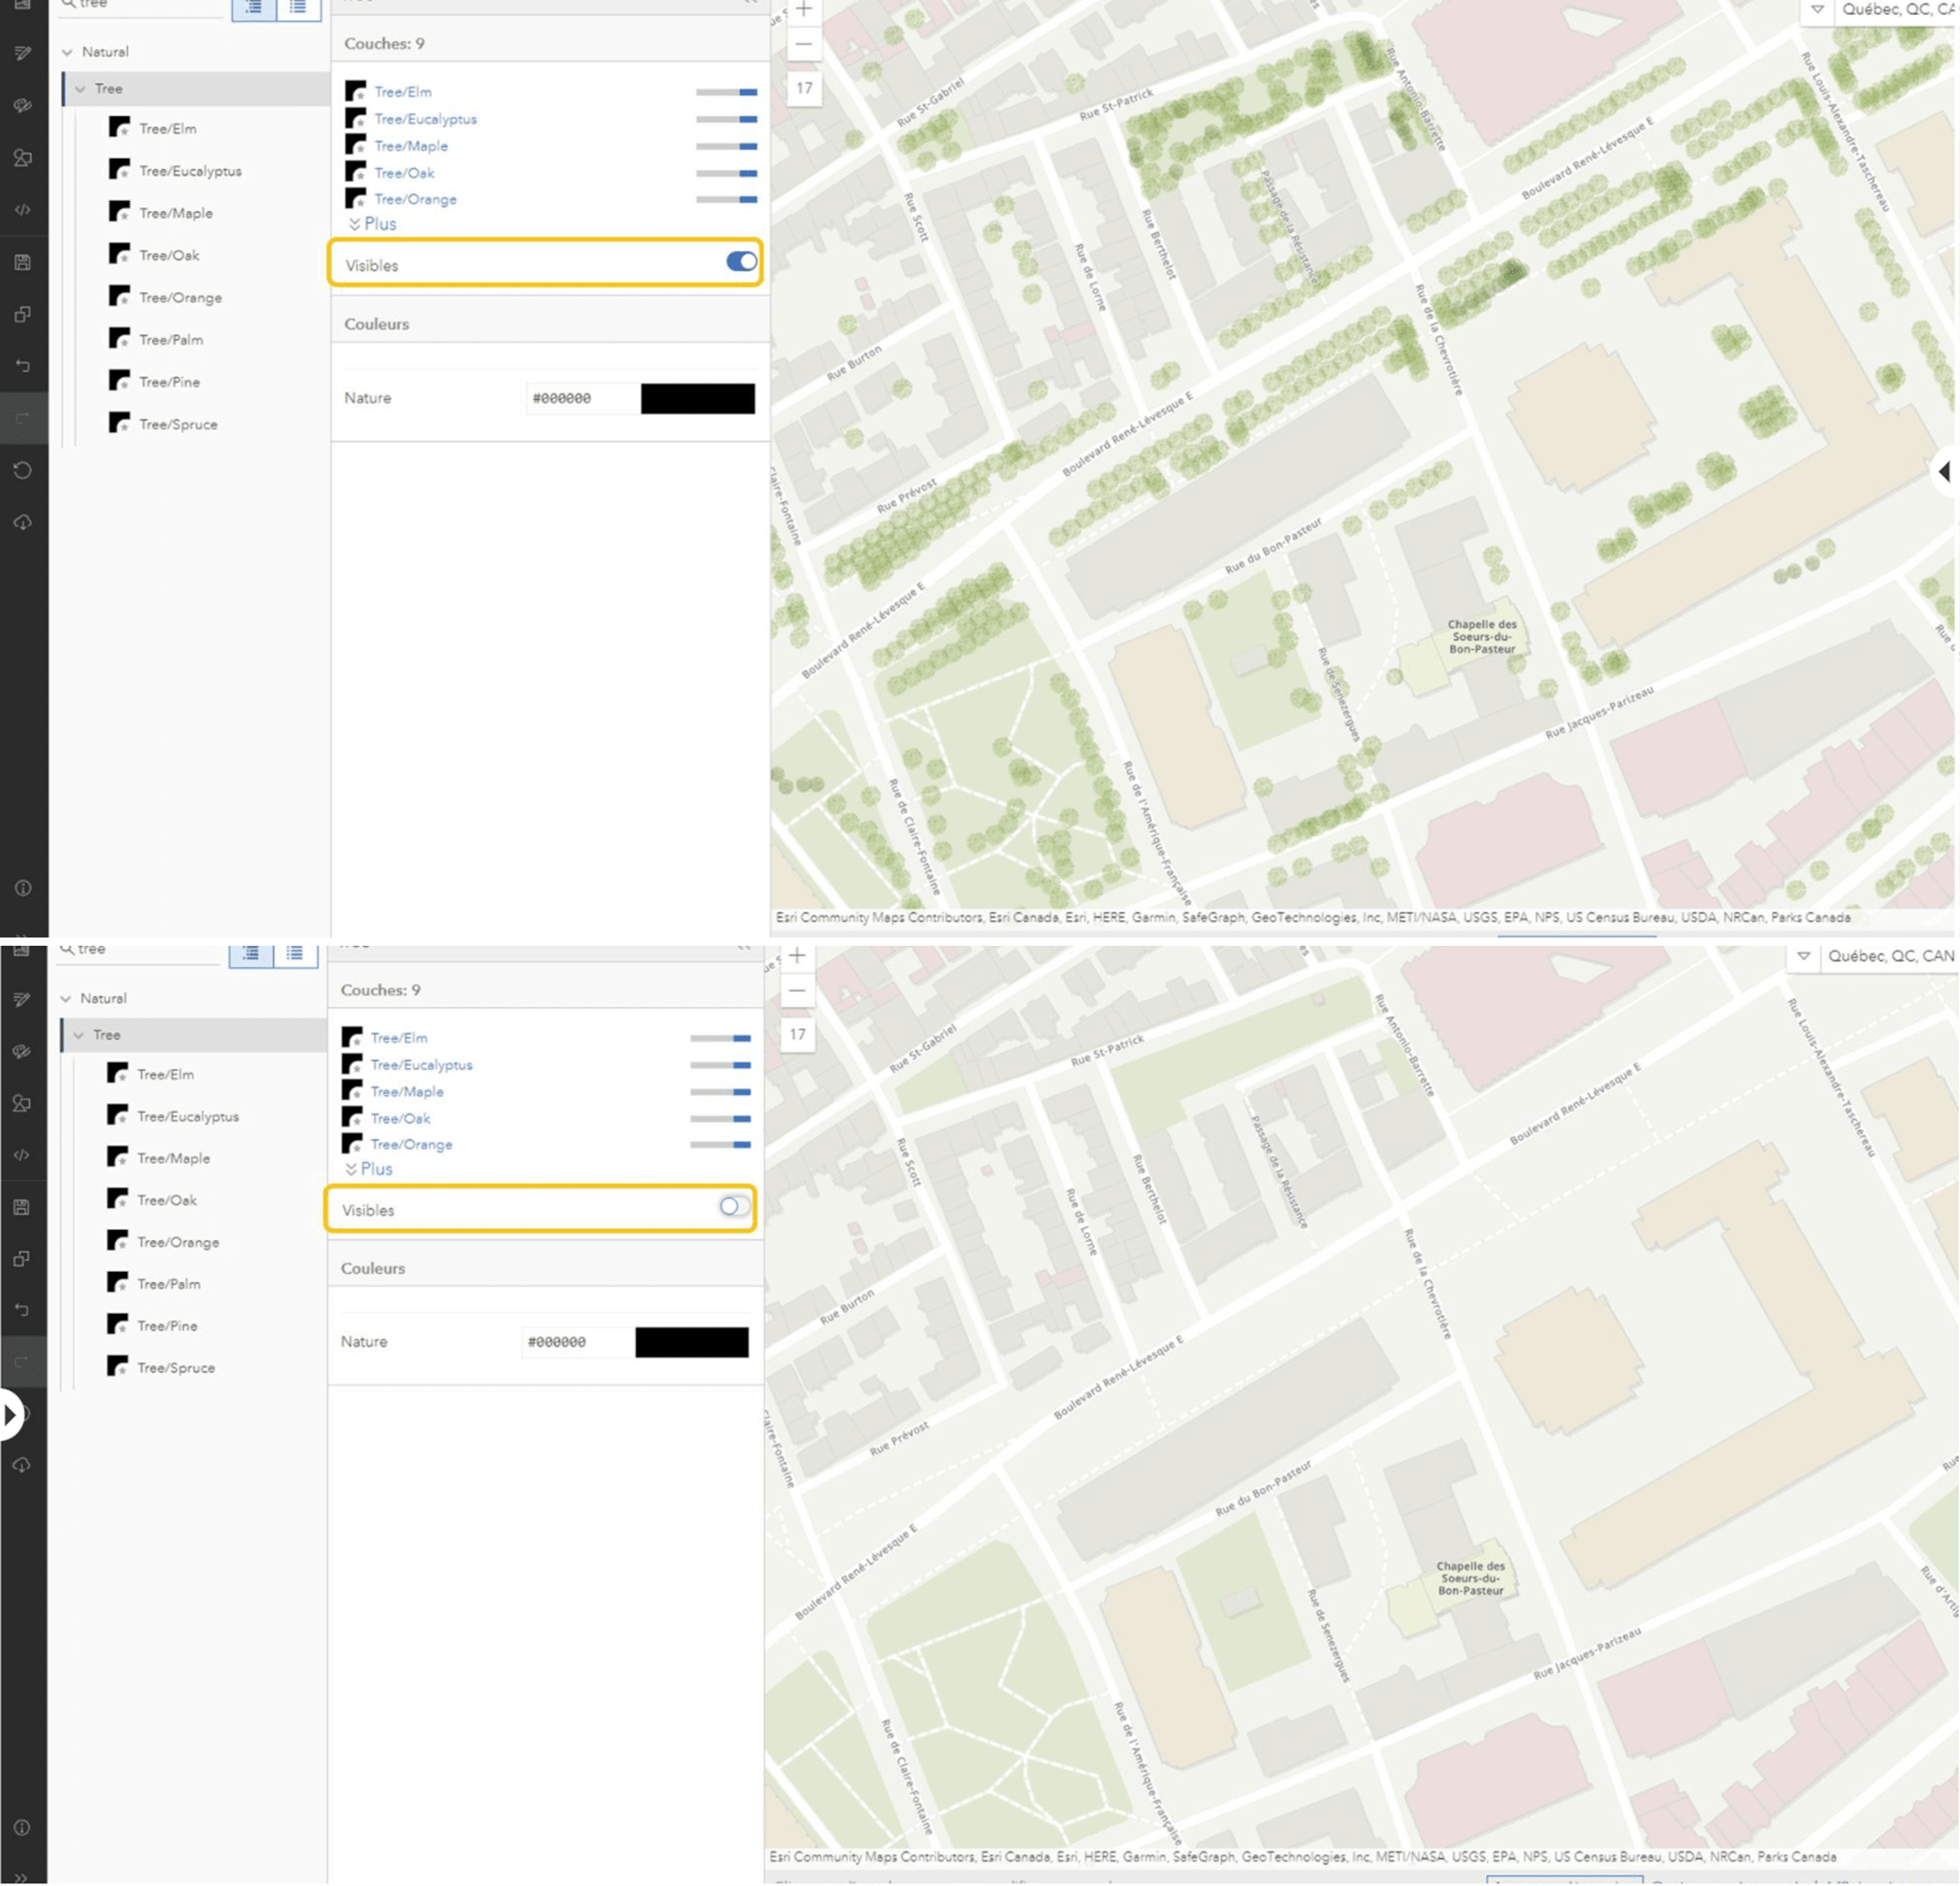
In the top image, the tree layer of Québec City, Québec, is still visible because the layer’s visibility is toggled. On the bottom, the trees are no longer visible because they have been set invisible. The data is not deleted, but rather made entirely transparent. This can be useful when creating different apps and wanting to highlight different data.
Some commonly asked questions we received during our webinars were the following:
Are there specific license requirements in order to use the ArcGIS Vector Tile Style Editor?
No, with any basic ArcGIS license subscription, you can use the ArcGIS Vector Tile Style Editor to customize your basemap styles. You can access the Community Map of Canada Topographic basemap without a license, but altering its appearance using the Vector Tile Style Editor software does require a user license.
Can I customize my own basemap layers?
Yes, you can certainly customize your own basemap that you have created. Simply access your produced basemap vector tiles through the Vector Tile Style Editor and edit away!
Can I access and use my customized basemap style across the ArcGIS system?
Yes, you certainly can! Basemaps customized using the ArcGIS Vector Tile Style Editor are saved in your ArcGIS Online account and can be found and managed under the Content section. There you can also manage sharing permission for all layers.
How can I access the ArcGIS Vector Tile Style Editor?
You can access the ArcGIS Vector Tile Style Editor straight from the browser or as a pop-up window accessed by clicking on the “Change style” button in Map Viewer Classic.
Does creating a custom basemap style use ArcGIS Online credits?
Using the ArcGIS Vector Tile Style Editor to customize basemaps does not consume AGOL credits. However, storing the resulting styled map does result in map and layers consuming credits.
This was the third blog of a three-part blog series about designing custom community basemaps using the Community Map of Canada: The first blog discussed the endless possibilities of creative basemap design and the second blog involved a tutorial of the ArcGIS Vector Tile Style Editor and outlined the main steps of basemap design. This third blog in the series shared design tips and answers for some of the most commonly asked questions. Check the others out for even more information on creative basemap design.