Designing Community Basemaps with the ArcGIS Vector Tile Style Editor: Part 1
Basemaps don’t have to be basic or boring. You can design them to suit any creative theme you like, from mimicking minimal Apple basemaps to designing fruity maximalist maps using Paul Cézanne’s oil paintings. Check out this three-part blog series to learn all about customizing the Community Map of Canada and other basemaps with the ArcGIS Vector Tile Style Editor.
This is the first blog of a three-part blog series about designing custom community basemaps using the Community Map of Canada: This first blog discusses the endless possibilities of creative basemap design; the second blog involves a tutorial of the ArcGIS Vector Tile Style Editor and outlines the main steps of basemap design; and the third blog shares design tips and answers the most commonly asked questions.
As a new GIS professional working in Community Mapping and storytelling, and also as a hobby artist on the side, my work for the Community Map of Canada has involved working the intersection of art and mapping a fair bit, to my happy surprise.
One such instance involved writing a community success story about the City of Saskatoon (a Community Map of Canada contributor since 2010!) creating a map of all their public artwork located throughout the city in a publicly-available StoryMap.
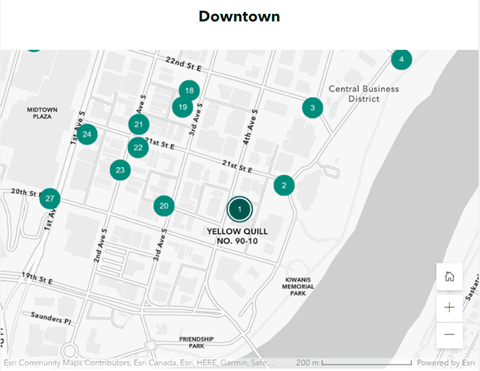
The map of downtown public artwork, from the City of Saskatoon’s Public Artwork StoryMap.
Another intersection of art and mapping is in our team’s work in designing and creating custom basemap styles for the Community Map for GIS users to use in maps and applications. Since 2020, we have released monthly creative basemap styles that showed the versatility of the basemap and of the ArcGIS Vector Tile Style Editor and have recently turned attention towards developing more strategic and specific use-case basemap styles. All styles can be found in our Custom Basemap Gallery – take a look and see which basemap styles you might like to apply to your mapping projects!
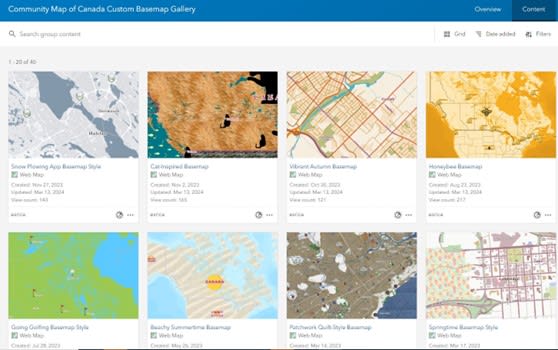
The Community Map of Canada Custom Basemap Gallery, showing eight of a few dozen creative basemap styles available in the gallery.
I also had the opportunity to present a number of webinars on creating various basemap styles – maps inspired by artists, maps with improved visibility and basemaps drawing on other common map and web styles. For the Esri France User Conference in October 2023, I demonstrated how to build a custom basemap using the artwork of French artist Paul Cézanne. Shortly after, in early 2024, I delivered French and English Esri Canada webinars alongside communities and colleagues that provided a tutorial on how to create one map that looked like Apple Maps and then another that was a higher-contrast and more visually accessible version of the Community Map of Canada.
For those who missed the webinars and/or wanted to learn more about the principles of basemap design, this three-part blog series summarizes the webinars’ content and also shares resources and advice on basemap design, putting you at that intersection of art and mapping too!
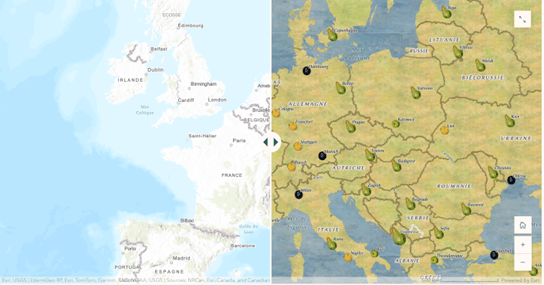
A comparison between the basic World Topographic basemap (in French) on the left and the world map styled to look like an oil painting by Paul Cézanne on the right.
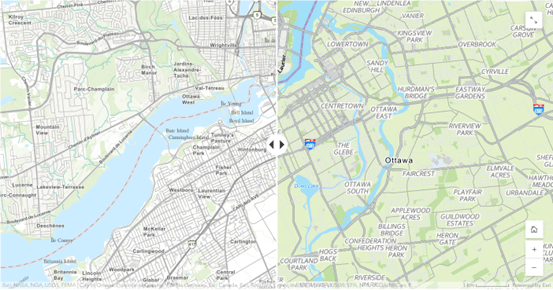
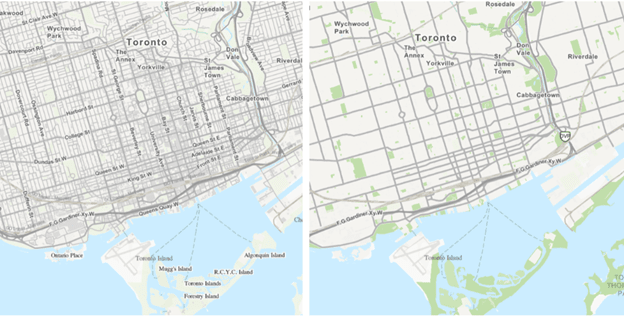
On the left, the Community Map of Canada Topographic Map (in Ottawa). On the right, the Community Map of Canada styled like Apple Maps.
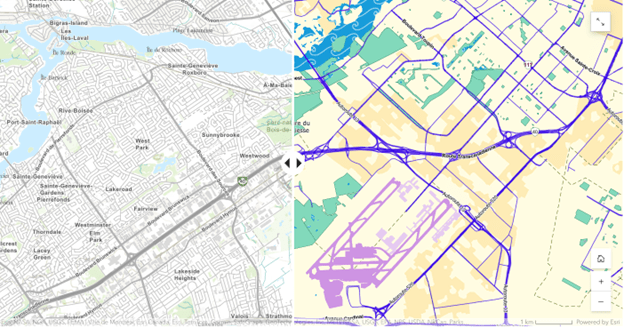
A transformation of the Community Map of Canada Topographic basemap (left) into a high-contrast style of the basemap (right).
This is the same Community Map of Canada Topographic basemap, but the only differences are that some data layers at this scale have been removed and that the green colour of the parks has been increased. See how the map becomes instantly less busy.
But before getting into the main steps of basemap design and customization, let’s first discuss the big ideas behind basemaps and why someone might want to create a custom basemap style.
What’s in a basemap?
Basemaps are important in cartography, as they serve as reference maps atop which GIS users overlay other data layers. Vector basemaps like the Community Map of Canada serve as the background of mapping projects and apps and are made up of multiple vector layers ‘baked into’ the basemap. Basemaps are the foundation of maps and provide important context for the geospatial data laid atop it.
The Community Map of Canada is an important player in the basemap game because it is comprised of directly contributed community data and is updated nightly and republished every 72 hours. The basemap program is made up of more than 400 communities who contribute data on a regular basis and keep the basemap and their communities up to date.
Why might someone want to create a custom basemap style?
Creating a custom basemap style can help GIS professionals accentuate or de-emphasize a certain aspect of their basemap in order to better communicate their data and findings. This might include creating a muted basemap (similar to the light grey style above) that would allow overlaid vector layers to be more apparent in a project or might involve changing the colour of different road types to highlight different parts of the network. It could also involve boosting the saturated green colour of parks and vegetation to highlight recreational or camping assets, for instance. The Community Map of Canada offers six standard out-of-the-box styles for this exact reason – to allow users to select if they would like a light or a dark themed map, if they would like roads accentuated or muted, or if they want to see imagery or just topography.
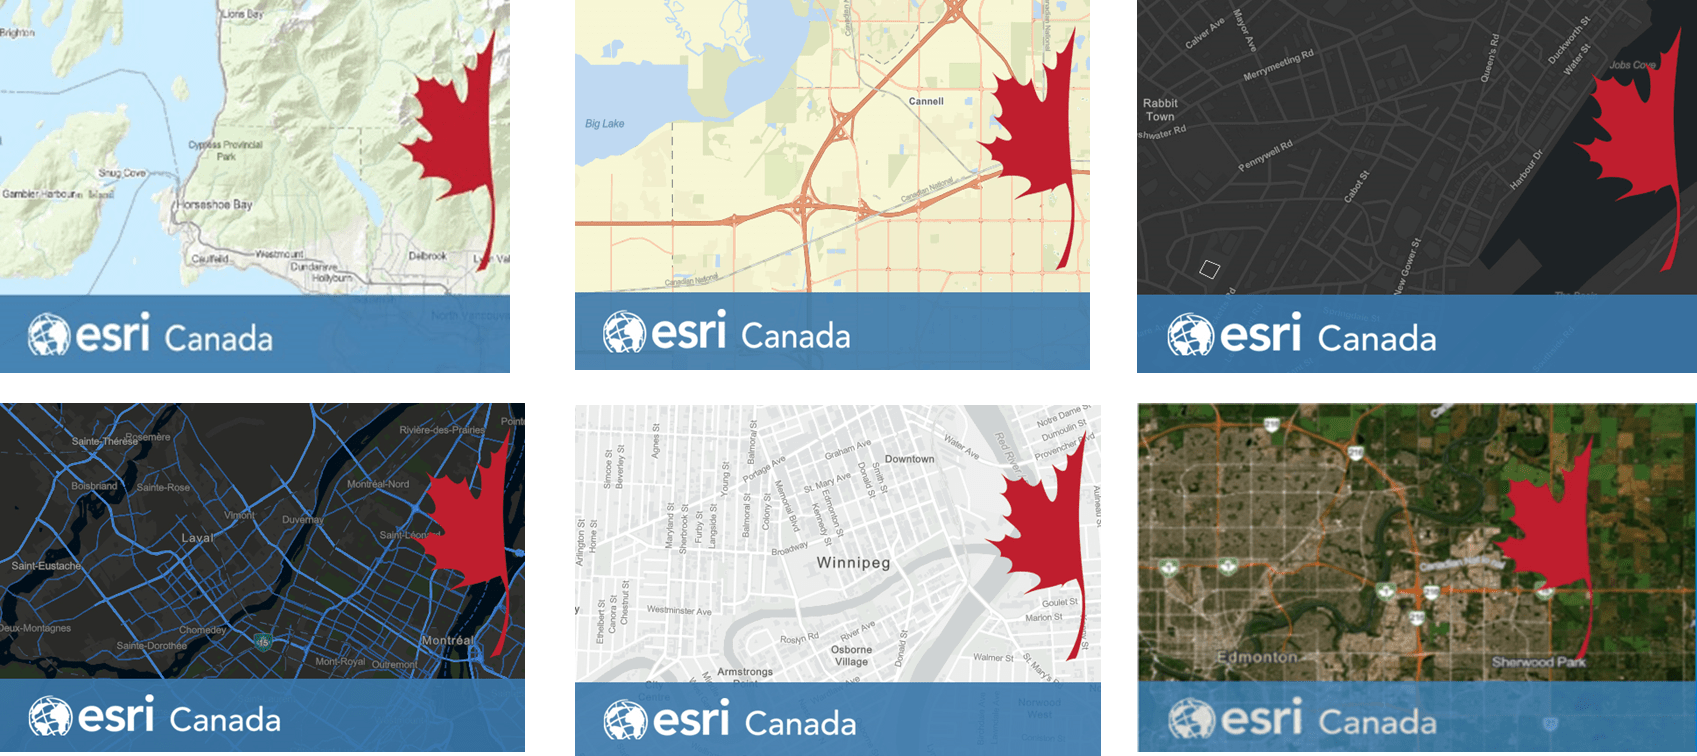
The six main out-of-the-box basemap styles of the Community Map of Canada. Styles clockwise from top left: Topographic, Streets, Dark Grey, Streets (Night), Light Grey, Hybrid Imagery.
What is the ArcGIS Vector Tile Style Editor?
The ArcGIS Vector Tile Style Editor is an Esri web application that allows users to interactively create custom basemap styles for Esri vector basemaps or self-created vector tile layers. The editing application allows for customization of individual layers for each feature type, to define colours, symbols and textures to set and customize labels and to control layer visibility and zoom level.
Given the versatility of this software, the main steps of basemap design (in my experience) are as follow:
- Choose a good starting point – select which basemap you want to modify (language, data layers, etc.
- Identify and develop your theme – what is your inspiration?
- Prepare the content of your basemap design – identify what changes you will make to the basemap to carry out your basemap design vision.
- Bring the icons, patterns, and colours into the ArcGIS Vector Tile Style Editor – execute your basemap design vision.
- Use your basemap style! – access and use your basemap style across your maps and projects.
To get deeper into the technical and artistic details of custom basemap design, navigate to the second article in this blog series.