Turning property data into GIS power
What does it take to turn fragmented property sketches into a fully integrated GIS-based approach? Insights from the 2026 GIS ValTech Conference show how the Kentucky Department of Revenue is transforming how property data is created, managed and used.
The transition from traditional property sketching to a fully integrated GIS-based approach is more than a technical upgrade. It represents a fundamental shift in how assessment organizations create, manage and leverage property data. A recent presentation by Esri Canada's Assessment Analyst GAMA team and the Kentucky Department of Revenue (KYDOR) at the 2026 GIS ValTech Conference walks through this evolution in the State of Kentucky as a real-world example, highlighting both the challenges and the transformative outcomes.
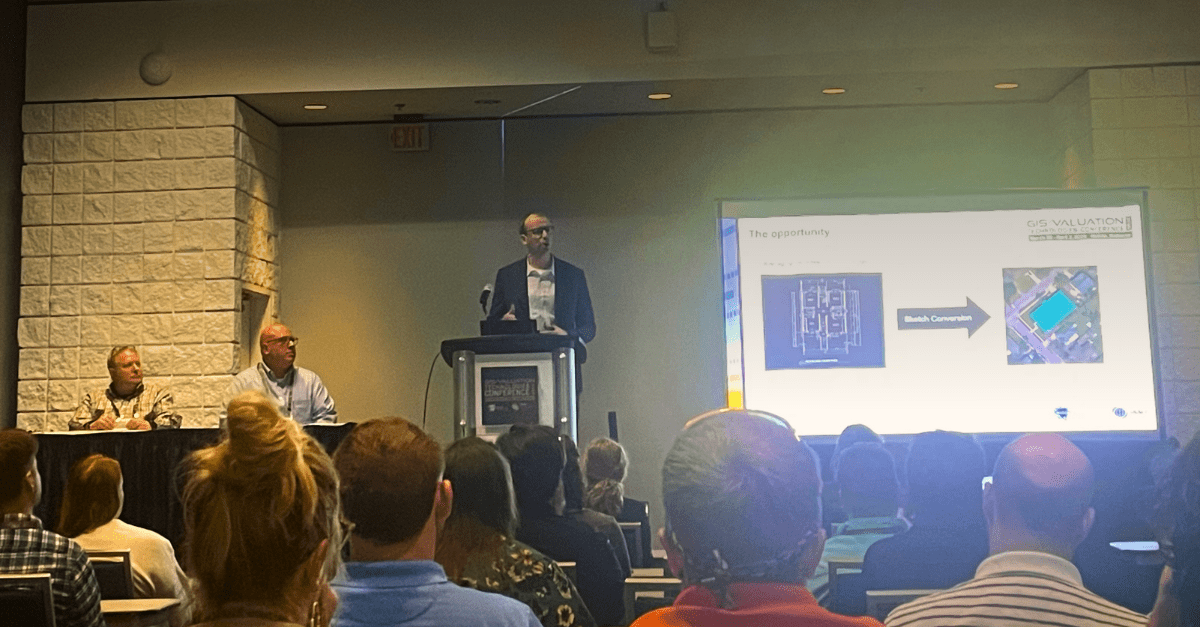
Brian Smith delivers a presentation to an audience at the 2026 GIS ValTech Conference in Mobile, Alabama.
At the core of the journey, there was a fragmented environment. With approximately 120 counties operating independently, there were some inconsistencies in how sketch data was recorded. Key challenges included:
- Multiple sketch formats such as PDFs, images and property cards
- Use of differing proprietary sketch systems
- Disconnected GIS environments and IT infrastructures
- Varying levels of staff expertise and resources
- Limited access to advanced GIS tools
This fragmentation led to some challenges they were facing, and KYDOR looked to the world of GIS to solve some of them.
The transition to a GIS-driven sketching workflow introduced a structured and reliable approach to managing property data. Legacy sketches were converted into GIS feature classes, georeferenced to align with real-world locations and verified to ensure accuracy and completeness. This end-to-end approach did more than modernize existing data; it established a foundation that ensured both quality and coverage across all participating counties.
With sketches integrated into the GIS environment, the value of this data expanded significantly. Users gained access to spatially accurate improvement data, allowing for better measurement of building size, shape and complexity. Changes to properties, such as new construction, additions or demolitions, could be visualized based on the latest imagery compared to the sketch data that is sitting in a GIS format. This resulted in a faster way to recognize differences between sketch data and changes to the improvements on a property.
A critical success factor was making the solution practical for everyday use. KYDOR needed a tool that staff from different counties could easily adopt, while still protecting how parcel data was viewed and shared between different counties. The solution supported a stand-alone application experience which allowed multiple editors to work at the same time throughout different counties, without seeing the other changes. Just as importantly, it is connected to existing GIS infrastructure, which helps reduce disruption and makes the transition easier for participating jurisdictions.
The impact also extended well beyond core assessment workflows by creating a GIS-ready dataset that could support additional operational and analytical use cases. Once sketch data was integrated into the broader GIS environment, this would support emergency management and disaster recovery efforts, where accurate parcel and structure data can help agencies quickly assess impacts, estimate damage, and support more timely reporting. One powerful use case emerged during recent natural disasters in Kentucky. KYDOR was able to leverage GIS-integrated sketch data alongside disaster-related information to quickly identify which properties were impacted. Because the data was reliable, spatially accurate and verifiable, teams could assess damage more efficiently and support more accurate reporting for the Federal Emergency Management Agency (FEMA). This helped ensure that the right properties were connected to recovery funding faster, while giving decision-makers greater confidence in the data used to measure the impact of the disaster.
Ultimately, Kentucky’s journey shows how GIS-based sketching can turn a long-standing data challenge into a modern assessment advantage. By moving sketches out of static formats and into a connected spatial environment, KYDOR created a more consistent, reliable and useful foundation for property data across participating counties. The result is not only better support for valuation and property review, but also a dataset that can serve broader public needs, from identifying property changes to emergency response. What started as a need to standardize sketch information has become a scalable model for improving accuracy, collaboration and decision-making across the assessment lifecycle.
A copy of the full presentation from Esri Canada’s Assessment Analyst GAMA team and the Kentucky Department of Revenue, delivered at the 2026 GIS ValTech Conference, can be found here.