The latest Canadian national datasets available in the Living Atlas
This blog provides valuable resources for latest Canadian datasets available in the ArcGIS Living Atlas of the World. Explore this list to learn more about infrastructure, demographic, and environmental data from various national sources.
The ArcGIS Living Atlas of the World offers a vast collection of geographic data from across the globe. Users can explore a variety of maps, apps, and data layers that can be applied to their work, all of which are accessible throughout the ArcGIS platform.-
Esri Canada oversees the curation of all Canadian content within the Living Atlas. We have made significant efforts to provide our users with national-level data from authoritative sources that they can easily incorporate into their workflows. While this data can be used singularly, these datasets can also be combined to answer more complex questions. Combing data from Statistics Canada and Natural Resource Canada users can explore the proximity of facilities to areas with demographic characteristics and assess how infrastructure, both existing and planned, might be affected by various environmental changes.-
Within this blog we will highlight only a subset of the Canadian national datasets available within the Living Atlas. We look forward to seeing how you leverage these datasets whether that be for research and analysis or adding further context to your already existing maps or apps. If you have any national level datasets you would like to see in the Living Atlas, please reach out to our Living Atlas Curator (livingatlascurator@esri.ca) we would love to work with you to get these added.-
Resources List-
Open Databases-
Statistics Canada, a major producer of open data, have helped create an exploratory initiative called the Linkable Open Data Environment (LODE).- This initiative aims at enhancing the use and harmonization of open micro data primarily from municipal, provincial and federal sources. One of the four pillars of the LODE are the Open Databases which provide valuable insights to facilities and infrastructure across Canada. Utilizing the Open Databases can provide a clear picture of what data is publicly available and can enhance organization’s internal datasets.--
The Open Database of Infrastructure (ODI) contains details on selected infrastructure across Canada. The data within the ODI are primarily provided by municipal, regional, provincial, or national sources available to the public under an open data license. The infrastructure included are as follows: airports, bridges, tunnels, ports, marinas, railways, solid waste facilities, wastewater, storm water, potable water, telecommunications, electrical grid, oil and gas, and low carbon infrastructure. Users can explore each dataset to access information about the infrastructure's provider, location, name and more.-
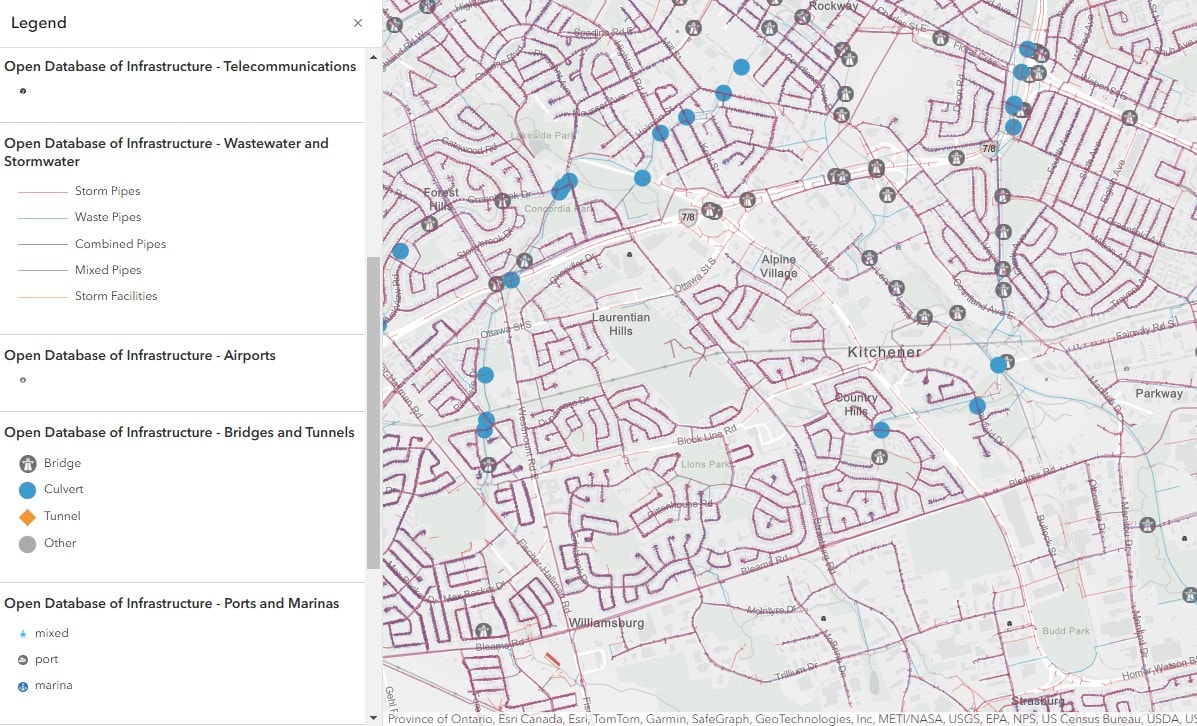
Map showcasing the Open Database of Infrastructure symbolized by infrastructure type in Kitchener, Ontario.
The Open Database of Healthcare Facilities (ODHF) database compiles open, publicly available, and directly provided data on healthcare facilities across Canada. These healthcare facilities are categorized into three types: Ambulatory Health Care Services, Hospitals, and Nursing and Residential Care Facilities. This database aims to provide users access to a harmonized listing of healthcare facilities; however, it is important to note it does not provide an exhaustive list of all health facilities and excludes alternative medicine (e.g., herbalists) and specialist areas (e.g., chiropractors, dentists, mental health specialists, etc.).--
The Open Database of Educational Facilities (ODEF) offers an overview of the educational facilities across Canada, covering 43 facility types including private schools, hospitals, and universities. It provides details such as name, type, and location for each facility. The ODEF was created by gathering microdata on educational facilities from open data portals, provincial or territorial websites and one federal department.-
The Open Database of Cultural and Art Facilities (ODCAF) aims to provide accurate and standardized locations for cultural and art facilities across Canada by using data provided by provincial, territorial, and municipal governments and professional associations. These facilities are categorized into nine types: art and cultural centres, art, festival site, gallery, heritage or historic site, library or archive, museum, theatre/performance and concert hall, and miscellaneous.--
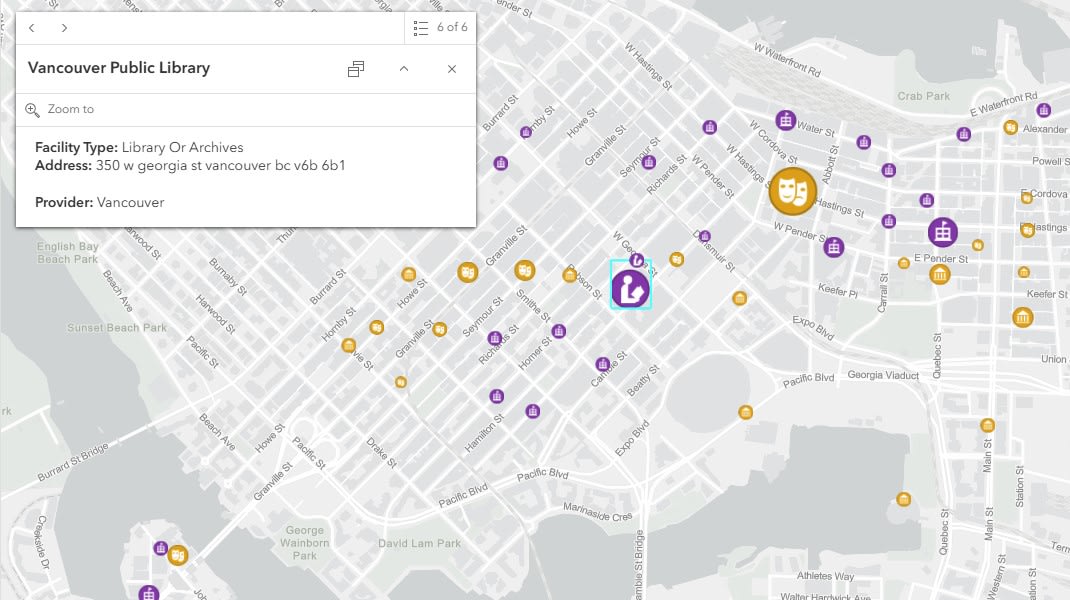
Map displaying features in the Open Database of Cultural and Art Facilities in Vancouver, British Columbia symbolized by facility type.
The Open Database of Sports and Recreation Facilities (ODSRF) contains information on facilities across Canada provided by provincial, territorial and municipal government sources. The database categorizes the facilities into 18 types, including arenas, parks, gyms, stadiums and more. Each entry includes details such as facility type, name, address, city, province or territory and geolocation data.-
Demographic Data-
Esri Canada has added a variety of different demographic data layers to the Living Atlas making it easy for you to access Statistics Canada census data in a GIS environment.- These data layers range across important topics such as housing, income and education. The data is provided at multiple census levels - Provincial, Census Division (CD), Census Subdivision (CSD), and Dissemination Area (DA), zooming into the map will determine which level is displayed.--
By utilizing these resources, users can explore financial and educational statistics in relation to housing policies, disparities and more. These insights can help address questions about the development of new housing and shelters and provide a deeper understanding of market housing prices in areas with specific income and educational backgrounds.-
The Canadian Population and Dwelling Counts 2021 dataset represents the number of Canadians whose primary residence is in a specific geographic area, regardless of their location on Census Day. Several factors are considered when compiling this data, so it is important not to interpret the population counts as reflecting the total number of people living in the reported dwellings. The Dwellings data refers to the total number of private dwellings and those occupied by usual residents in Canada. By selecting a province or territory, users can access additional information about changes in population and dwellings between 2016 and 2020.-
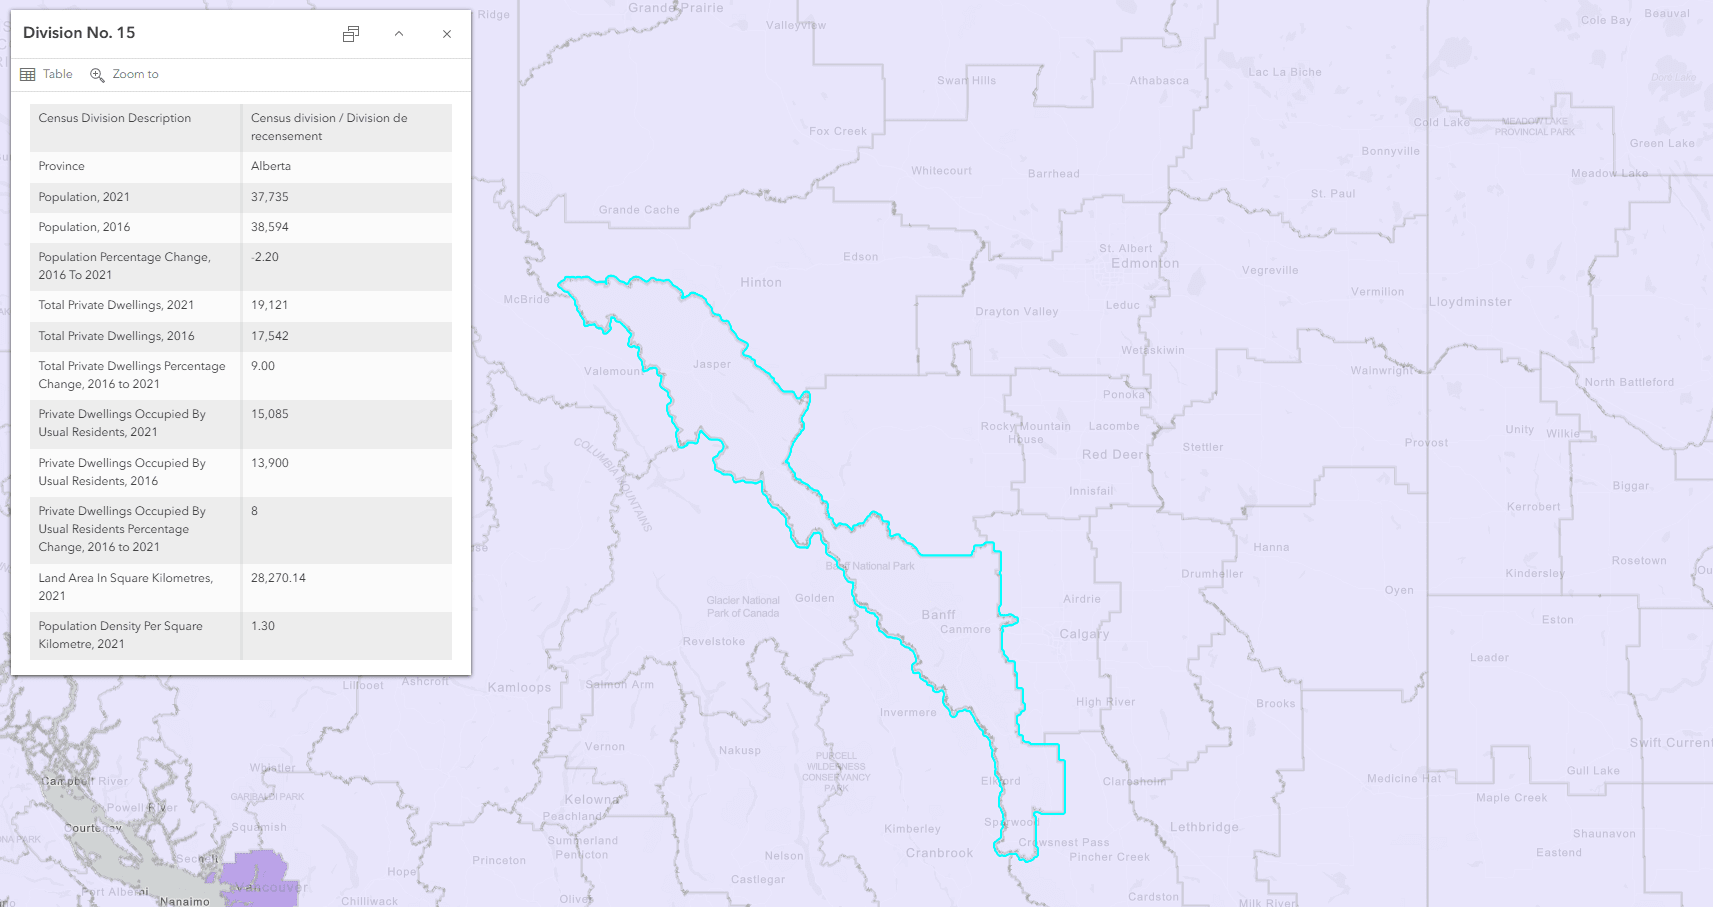
Map showcasing population and dwelling counts from census 2021 data in Alberta, Canada, symbolized by population density per square kilometer.
The Canadian Shelter Costs 2021 dataset provides data on the shelter cost-to-income ratios for households in Canada. These ratios are broken down by total population, homeowner, renter, and individuals residing in government, First Nation, or Indian Band-provided dwellings. The shelter cost-to-income ratios are determined by dividing the average monthly shelter cost by the average monthly total household income, then multiplying the result by 100.--
The Canadian Median Household Income 2021 dataset presents the medial total income (pre-tax) for households in Canada from 2020 and 2015, based on data from the 2021 census. The data is symbolized by the median household income in 2020 and upon selecting a province or territory, the pop-up pane states the change in median household income from 2015. This change is represented as either a positive or negative value, indicated by a plus (+) or minus (-) sign.-
The Canadian Age and Gender 2021 dataset offers information on the average age for each province, broken down by total population, men and women. Each province or territory is symbolized by the average age for the selected region. When a province or territory is selected, users can also learn about the predominant age group for that area. The categories for total population, men, and women are further divided into groups: 0-14 years, 15-64 years, 65 years and over, as well as average age and median age, with additional detailed age ranges provided.-
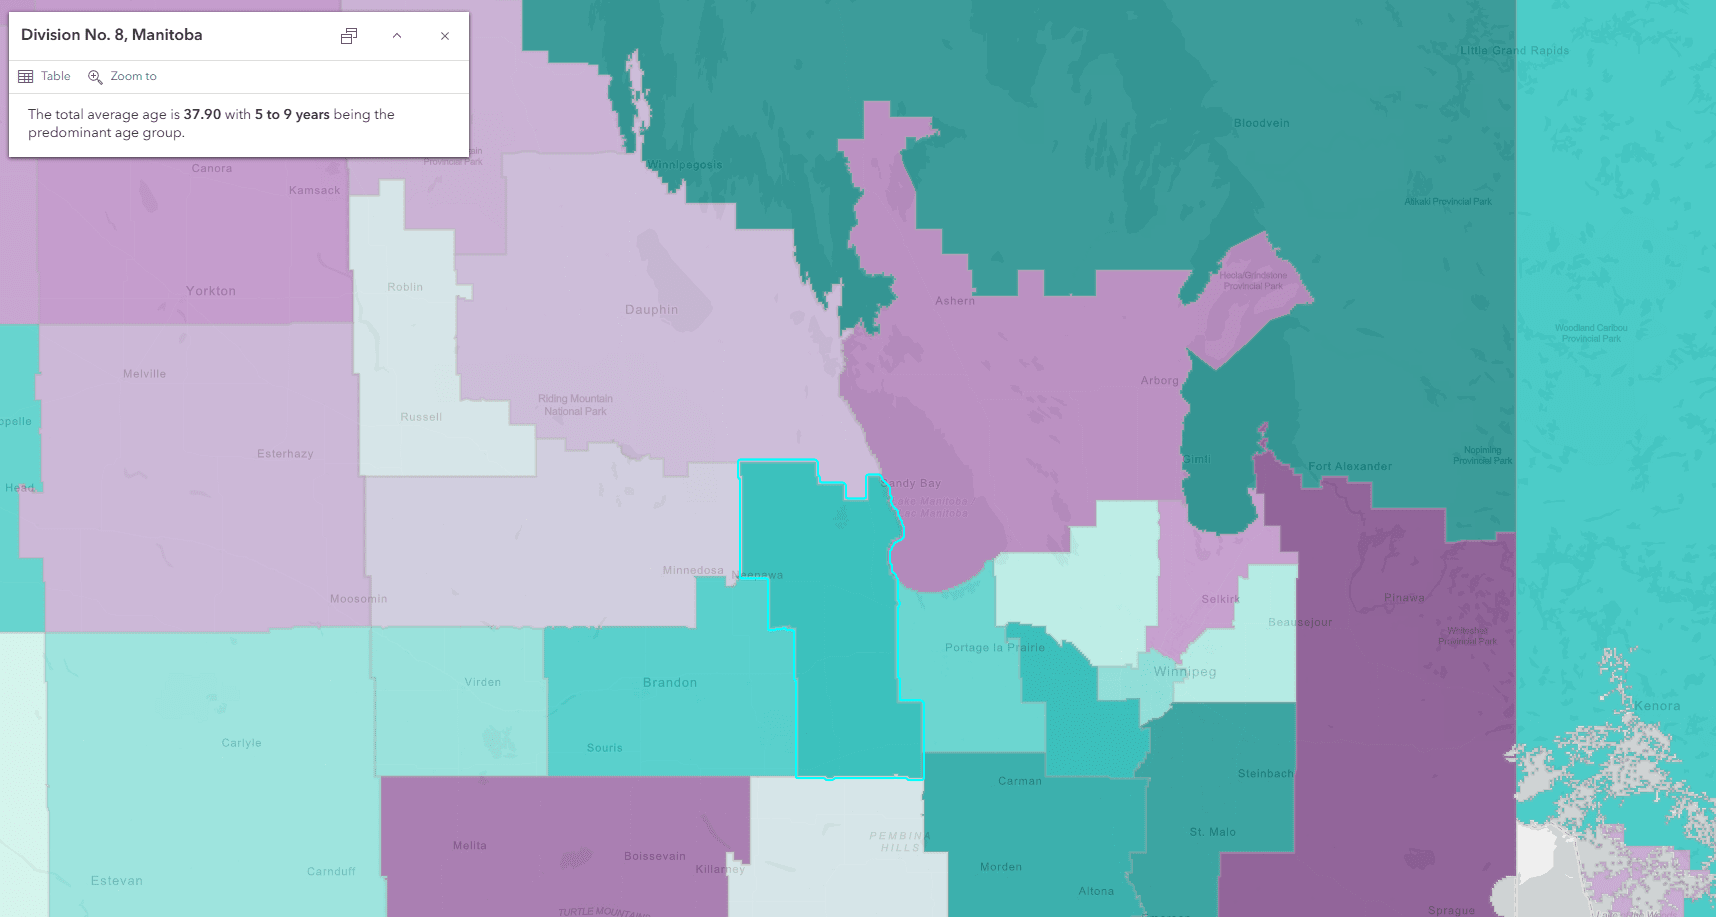
Map displaying age and gender census 2021 data in Manitoba, Canada, symbolized by total average age of the each division.
The Canadian Employment Income by Level of Education 2021 dataset presents the average and median employment income for individuals aged 15 and older in private households, categorized by their level of education. The dataset covers 25% of the Canadian population aged 15 and over. For each province or territory, data is provided across 18 categories, including total population with employment income, and further divided into groups such as no certificate, diploma or degree; high school diploma or equivalency certificate; and postsecondary certificate, diploma, or degree.-
Environmental Data-
Within the Living Atlas you can find environmental data provided by government agencies such as Natural Resource Canada and Agriculture and Agri-Food Canada. Environmental data can highlight changes over time, helping to raise awareness of environmental shifts and address issues pertaining to Canadian environmental policies or regulations.--
The Canadian Forest Industry Hotspots dataset is a part of the Government of Canada’s Forest Change Data Catalogue and associated with The State of Canada’s Forests Annual Report. This dataset highlights the locations of mills and illustrates the varying sensitivity of forest communities and regions to the forest industry. It offers insight into the significance of the forest industry to regional economies across Canada. The mill facilities layer includes details about the location, type and ownership of each mill, while the sensitivity layer indicates which forest communities and regions are most vulnerable to the economic impacts of the forestry industry.-
The Canadian Wetland Inventory Map dataset provides a high-resolution, 10-meter wetland inventory for all of Canada. This third-generation version was produced in 2021 and includes more data sources to expand inventory across more provinces. Using a range of multi-source Earth Observation imagery collected between 2016 and 2020, the wetlands inventory map covers about one billion hectares and categorizes wetlands into five types: bog, fen, swamp, march and water.-
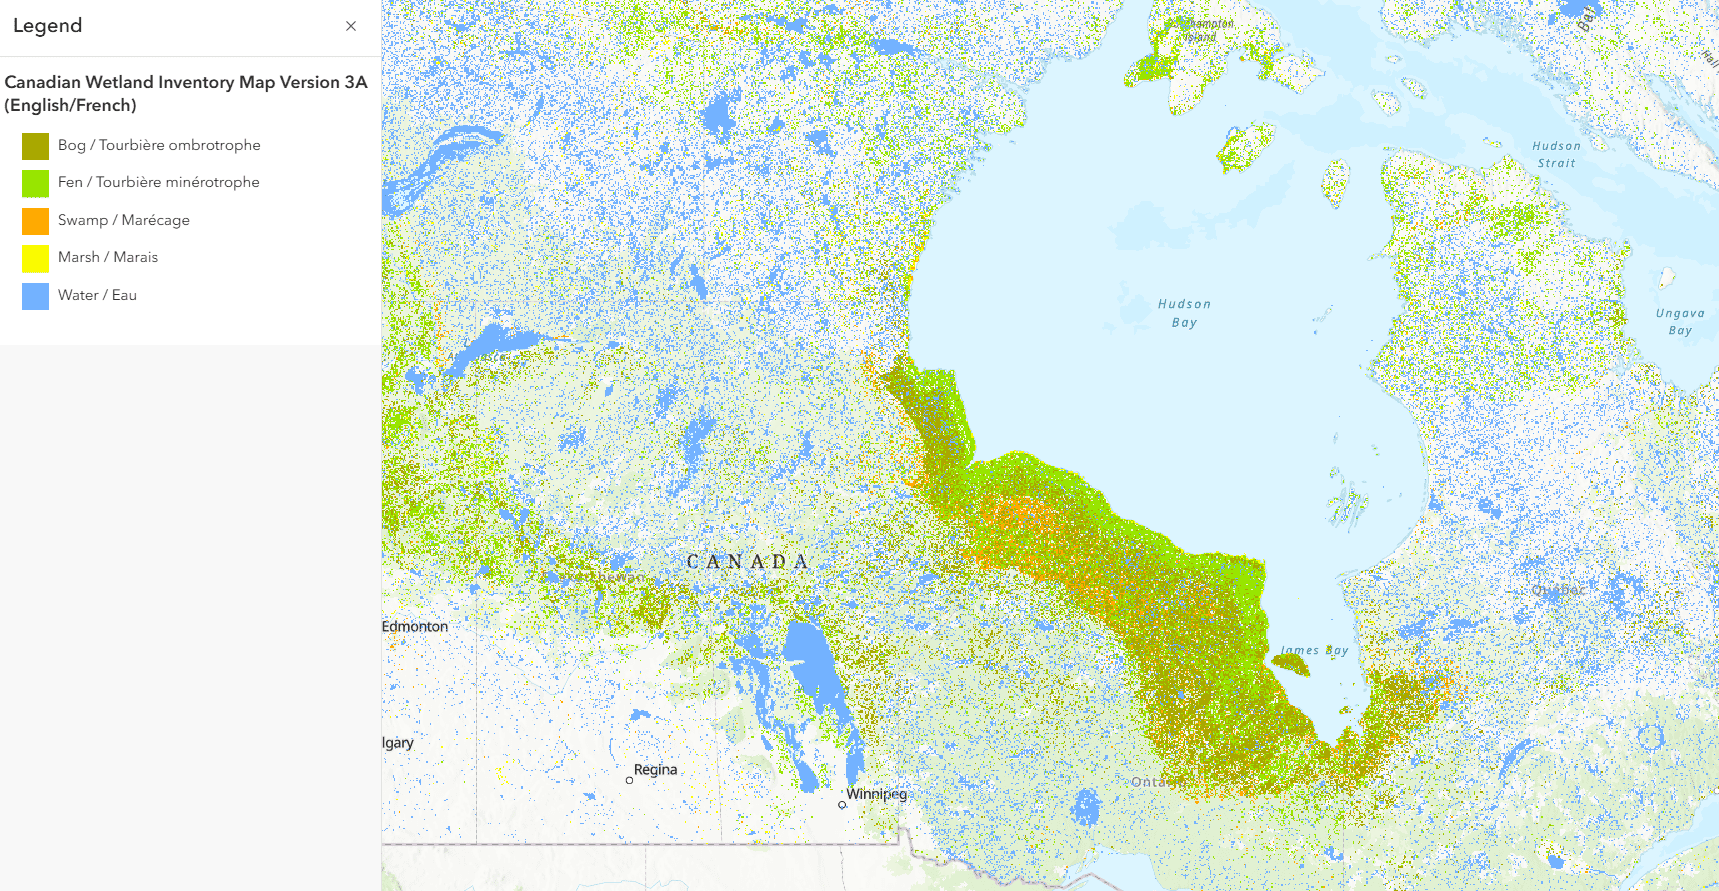
Map showing the wetland inventory across central Canada.
The following three datasets are obtained from the Agroclimate Maps produced by Agriculture and Agri-Food Canada (AAFC). These maps use in-situ weather observations assembled within 12 hours of their collection at the federal, provincial, and private levels.-
The Agroclimate Heat Wave Map shows heat waves across Canada over the past 10 years. A heat wave is defined as the consecutive number of days (from April 1 to October 31, covering the growing season) where the maximum daily temperature in a region exceeds 25 or 30 degrees Celsius respectively. Users can utilize the timeline feature below the map to select a specific year from the past 10 years, and the map will update to reflect conditions for that date.-
The Agroclimate Dry Spell Map offers data on dry spells across Canada over the past 10 years. Dry spells are defined as the number of consecutive days within the date range (April 1 to October 31, representing the growing season) during which daily precipitation was less than 0.5mm. Users can use the timeline feature below the map to select a specific date from the past 10 years, and the map will update accordingly to reflect conditions for that date.-
The Palmer Hydrological Drought Index dataset measures dryness by evaluating recent precipitation and temperature, using a supply-and-demand model of soil moisture. This index has been used to assess various conditions including long-term drought, variations in soil moisture and other related factors. Users can use the timeline feature below the map to select a specific date from the past 10 years, and the map will update accordingly to reflect conditions for that date.-
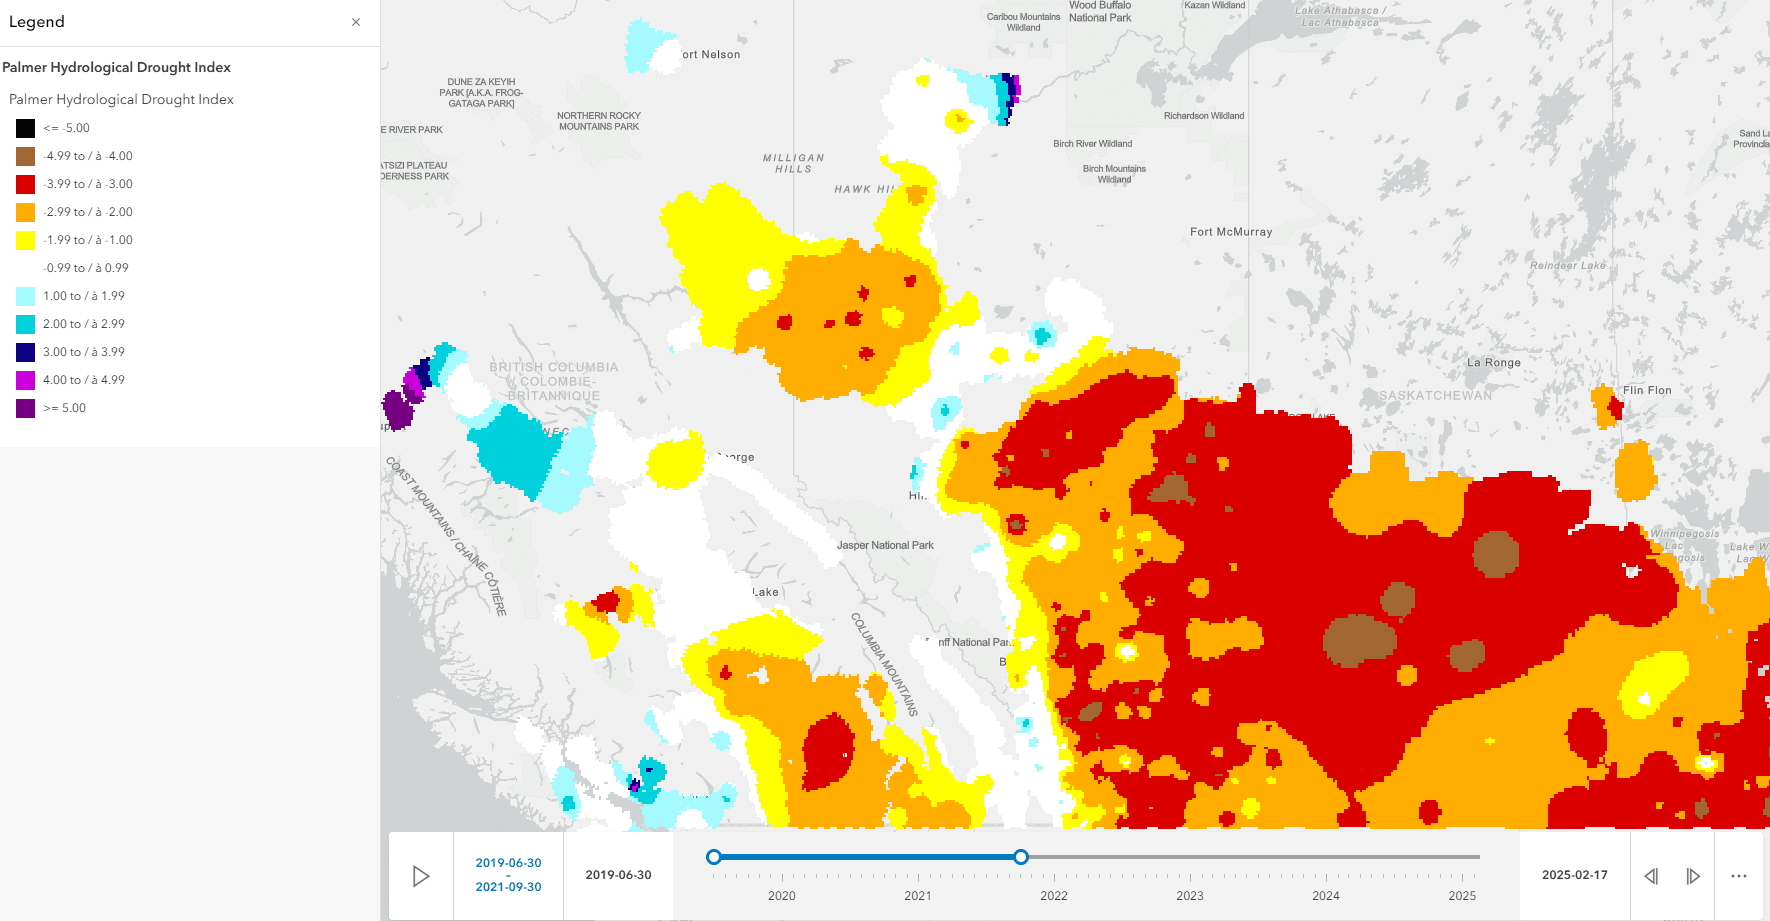
Map displaying the Palmer Hydrological Drought Index across Western Canada with a legend and timeline widget.