Addressing homelessness using the geographic approach
No matter which city you live in, homelessness is a very complex issue. Real-time data is required to break down that complexity, adapt to changing conditions and communicate to diverse teams where and how to allocate resources across sites. Using a geographic approach helps teams understand the specific needs of each site, develop better informed plans and coordinate actions to ensure community services are delivered effectively.
According to Statistics Canada, an average of 235,000 people in Canada experience homelessness each year. It is a complex problem that intersects various structural, societal and individual issues including unemployment, discrimination, domestic violence, mental health and addiction. Collecting data about homelessness can be difficult because of its transitional nature—it is challenging to observe or count each individual at the moment they are experiencing homelessness. Also, stigma and prejudice towards people experiencing homelessness usually hinder them from self-identification.
The geographic approach brings clarity
Geography, the study of places on Earth and the relationships between people and their environments, has always been a powerful force in government and business. Today’s high-tech maps are enriched with data on everything from traffic and weather to wildfire threat. Geography is a way of pulling all key information together into a dynamic map to see visually stunning stories about what’s happening now, what has happened in the past, and what will happen next. Our most serious challenges like climate change, sustainability, global public health, social inequity and homelessness are inherently spatial. To solve such complex problems, we must first understand them in the crucial context of location. When we visualize and analyze data on a map, hidden patterns, trends and relationships emerge. This framework for problem solving, called the geographic approach, is data driven and provides location intelligence—insights that empower real-time understanding and transform decision-making.
The geographic approach, combined with modern geographic information system (GIS) technology, can play a significant role in addressing homelessness by providing valuable insights and tools for planning, analysis and decision-making. Here are some ways the geographic approach and GIS can help:
1) Mapping and analyzing data: GIS can map the locations of homeless populations, shelters and services, helping to identify patterns and trends. This can reveal areas with high concentrations of homelessness and highlight gaps in service provision.
2) Resource allocation: By visualizing data on a map, policymakers and service providers can better allocate resources, such as funding, shelters and outreach programs, to areas with the greatest need.
3) Tracking and reporting: GIS can be used to track the effectiveness of interventions and programs over time. This helps in reporting progress and making data-driven adjustments to strategies.
4) Identifying risk factors: GIS can analyze various risk factors, such as economic conditions, housing availability and demographic data, to predict areas where homelessness is likely to increase. This allows for proactive measures to be taken.
5) Improving coordination: GIS can facilitate better coordination among different agencies and organizations by providing a common platform for sharing data and insights. This ensures a more integrated approach to addressing homelessness.
6) Public awareness and advocacy: Maps and visualizations created using GIS can be powerful tools for raising public awareness and advocating for policy changes. They can clearly communicate the scope and scale of homelessness to stakeholders and the general public.
By leveraging the geographic approach and GIS, communities can develop more effective strategies to combat homelessness and ensure that resources are directed where they are needed most.
Case study: Mobile GIS application helps Abbotsford understand homelessness
The City of Abbotsford in British Columbia supports the Integrated Outreach Meeting (IOM), a group of community outreach workers who regularly meet to discuss challenges, opportunities and trends in homelessness. IOM initiated the creation of the Community Homelessness Information Application, or CHIA, to better understand and serve those experiencing homelessness in the City, specifically those who are staying in encampments or shelters, or sleeping rough outside.
They wanted to create an easy-to-use mobile application that would allow frontline workers to input and update data related to encampments, sleeping sites, day sites and shelters to improve coordination of services and create long-term data to help advocate for more resources.
The City’s GIS team developed CHIA using their existing Esri ArcGIS technology, a comprehensive enterprise geospatial platform. They leveraged ArcGIS Field Maps to create a mobile application used by outreach workers to update statistics at different encampment sites, day sites and sleeping sites and indicate what services they provided at each site.
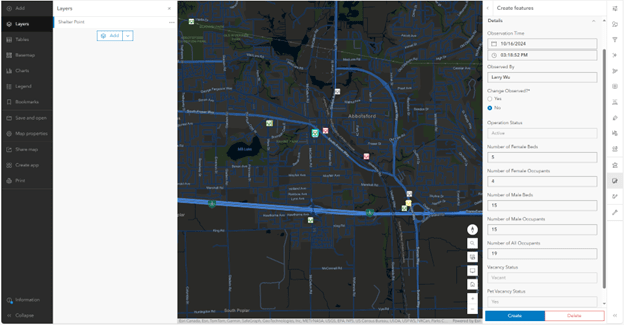
 A web map application with smart forms using the Map Viewer application allows shelter workers to update the status of their shelter beds in real time to help outreach workers and other shelters know where there are vacant beds to which they can refer their participants.
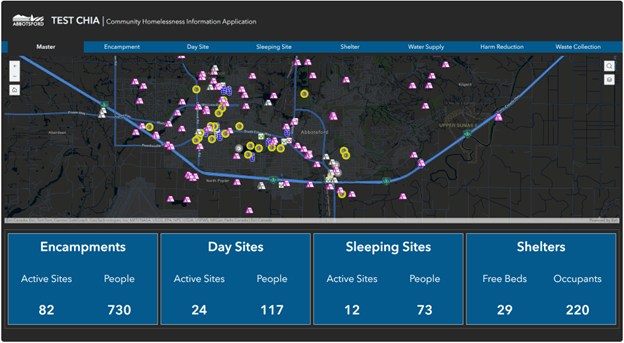
 A comprehensive dashboard built with ArcGIS Experience Builder gathers data into one source to allow frontline workers to better coordinate their efforts.

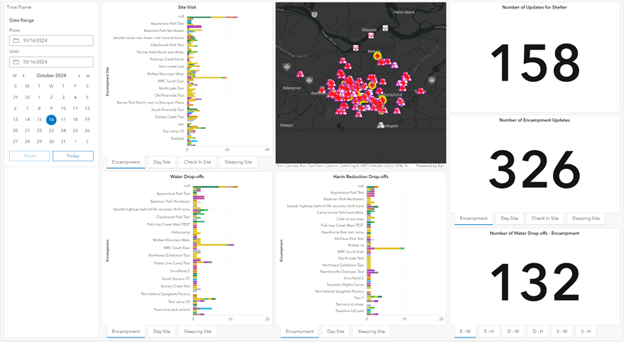
A manager’s dashboard configured from ArcGIS Dashboards pools data into one source, providing an overview of where services are being delivered in the community, how many updates each site receives, and the amount of visits each site is receiving. Finally, an ArcGIS Pro project package containing modelling tools is also provided to report collected data.
The City is also subscribed to the Esri Advantage Program, which provides access to a dedicated advisor for technical and strategic support in implementing GIS. Through the program, the City uses the service credits for consulting with the advisory team for the review of the organization’s GIS architecture and recommendations on future evolution, as well as coaching for technical challenges during development.
"Since the launch of CHIA, outreach workers have been able to better coordinate their efforts ensuring better service coverage across the city,” said Peter Sparanese, city manager, City of Abbotsford. “They can now prioritize sites based on when the last time services were delivered, the kind of services they received, and how many people require services at each site. They also receive reports that track the sites and frequency of visits for reporting purposes, saving them valuable time. All these functions provided through this digital solution elevate how we support those experiencing homelessness and contribute to creating a better and more livable city.”
Uptake on the use of CHIA has been excellent. Since its launch in late February 2024, there have been more than 2,000 data updates made at sites, over 1,700 deliveries of resources at encampment sites and more than 1,000 deliveries of resources at day sites.
Education and user engagement critical to CHIA’s success
Training is very important, and following up with CHIA users is equally as important, as the outreach and shelter workers are truly what make CHIA effective. The City has conducted all of its training sessions via MS Teams in order to train multiple people at the same time. The virtual environment also enables the trainer to display their mobile phone screen for outreach workers and their web-based application for shelter workers to participants so they can learn how to use the apps in real time.
Follow-up sessions have included identifying inputs or updates in the system that are incorrect and working with the CHIA user to correct them and providing refresher training, sometimes in person, as necessary. The City also sends email reminders and updates related to CHIA, which continue to encourage users that their inputs are what make the system helpful to everyone in the community. User feedback is then shared with the GIS team, so they can make updates and improvements to the system as quickly as possible.
As a result of hands-on training and timely follow-up whenever necessary, the app has had great uptake from CHIA users.
Building on current successes
The City has expanded its use of CHIA to coordinate the delivery of Emergency Weather Response supplies in response to the heat wave the community is currently experiencing. Outreach workers are able to indicate where they have dropped off water supplies, which have an expiry of 4 hours to ensure frequent drop-offs. This fall, CHIA will be integral to a Point-In-Time Count that will include a 24-hour count of the number of people experiencing homelessness accompanied with surveys for those willing to participate.
The GIS team will add icons to CHIA to track which locations have been enumerated and surveyed, and use zone overlays on CHIA’s current Outreach Map to coordinate the deployment of survey teams. In the future, the team plans on developing a new application that will allow the community to search, filter and identify services on a map using ArcGIS technology. This will allow for an easier way to access services in Abbotsford. With such a responsive GIS team and a highly participatory Integrated Outreach Meeting, more improvements and useful applications are expected to come.
“The CHIA app is a perfect example of the ingenuity that comes out of collaboration and the desire to work together toward a common goal. City staff, outreach workers and social service providers came together to identify the needs of those serving the most vulnerable members of our community, brainstormed ways to coordinate their efforts and our City team was able to bring those ideas to life through the creation of an app that utilizes our municipal GIS mapping and location technology. CHIA is proving to be an invaluable tool for supporting our local service providers who are supporting those experiencing homelessness in Abbotsford.”
- City of Abbotsford Mayor Ross Siemens
The City of Abbotsford has embraced the geographic approach to understanding and addressing homelessness. They made the most of their existing geospatial platform and the Advantage Program to create an app that is helping them deliver better services to the most vulnerable in their community.
For municipalities with limited GIS capacity, a good start is to look at free, ready-to-use homeless risk-reduction templates in ArcGIS Solutions.
Addressing homelessness is a complex issue that requires multi-faceted solutions. By breaking down the problem and bringing clarity through the geographic approach, we can create solutions to understand the interconnectedness of many factors contributing to the issue, identify the kinds of interventions to make, and when and where to make them. As in the Abbotsford example, solutions that enable collaboration across government departments and agencies make solving a daunting problem more attainable.
The team at Abbotsford recently delivered a webinar about the CHIA app. Watch the recording
Contact us at publichealth@esri.ca.