How to Use the Number Selector to Filter Multiple Layers in Your Dashboard
ArcGIS Dashboards are a great option for users to display, analyze and monitor their data. Dashboards provide many options for customizing your project, such as category selectors, number selectors and data selectors. The number selector is an interactive element that allows users to filter data dynamically based on numerical criteria, such as specific numerical values or a range of values. This blog will dive into the configuration and use of the number selector to filter multiple layers in your dashboard.
Practical example
Imagine you are managing infrastructure monitoring data across Canada. You have two layers: one for inspection reports of research stations and another for inspection reports of weather monitoring stations. By using the number selector, you can filter these layers based on the scores assigned during inspections. For instance, you could set a range to display only those research stations and weather monitoring stations that ranked between 0 and 15 on a specific scale. This allows you to quickly identify facilities that might need maintenance or repairs, helping you prioritize infrastructure improvements and ensure safety.
Preparing the dashboard
-
Add your Web Map
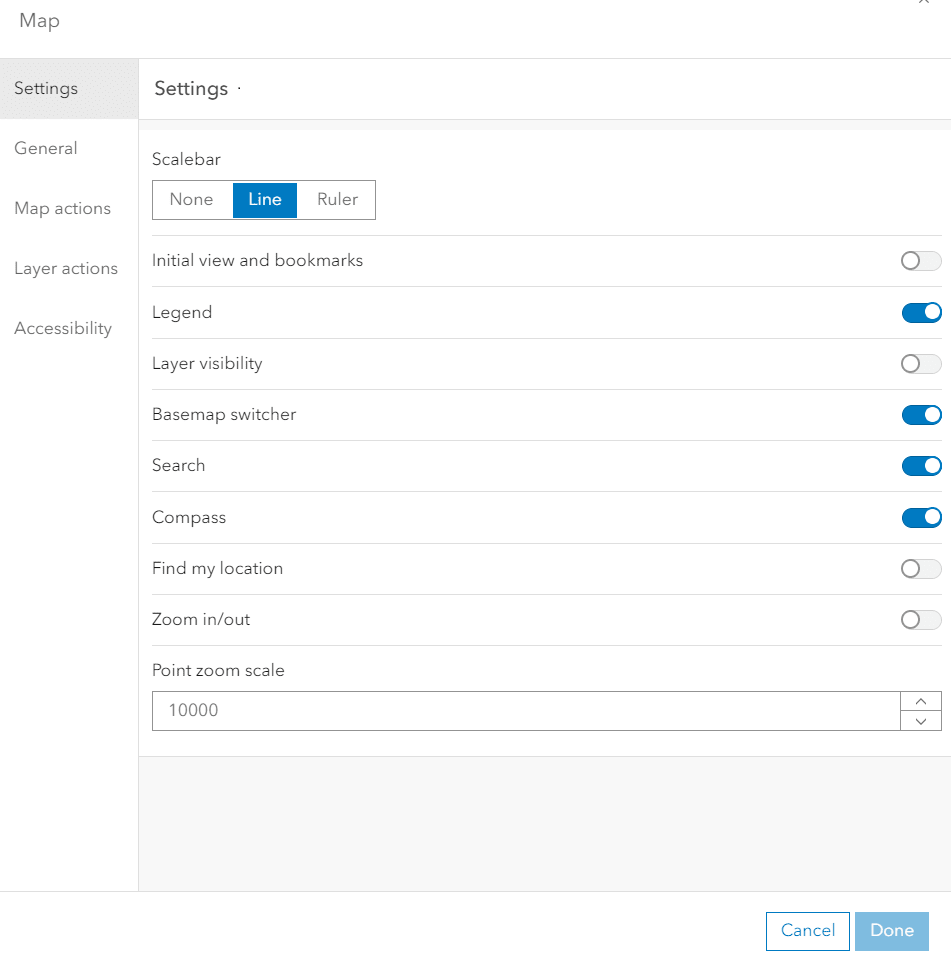
If you have not already added your Web Map to the dashboard, begin by selecting the Web Map of your choice. To do so, click the plus button to add it, then configure any map settings to suit your needs.
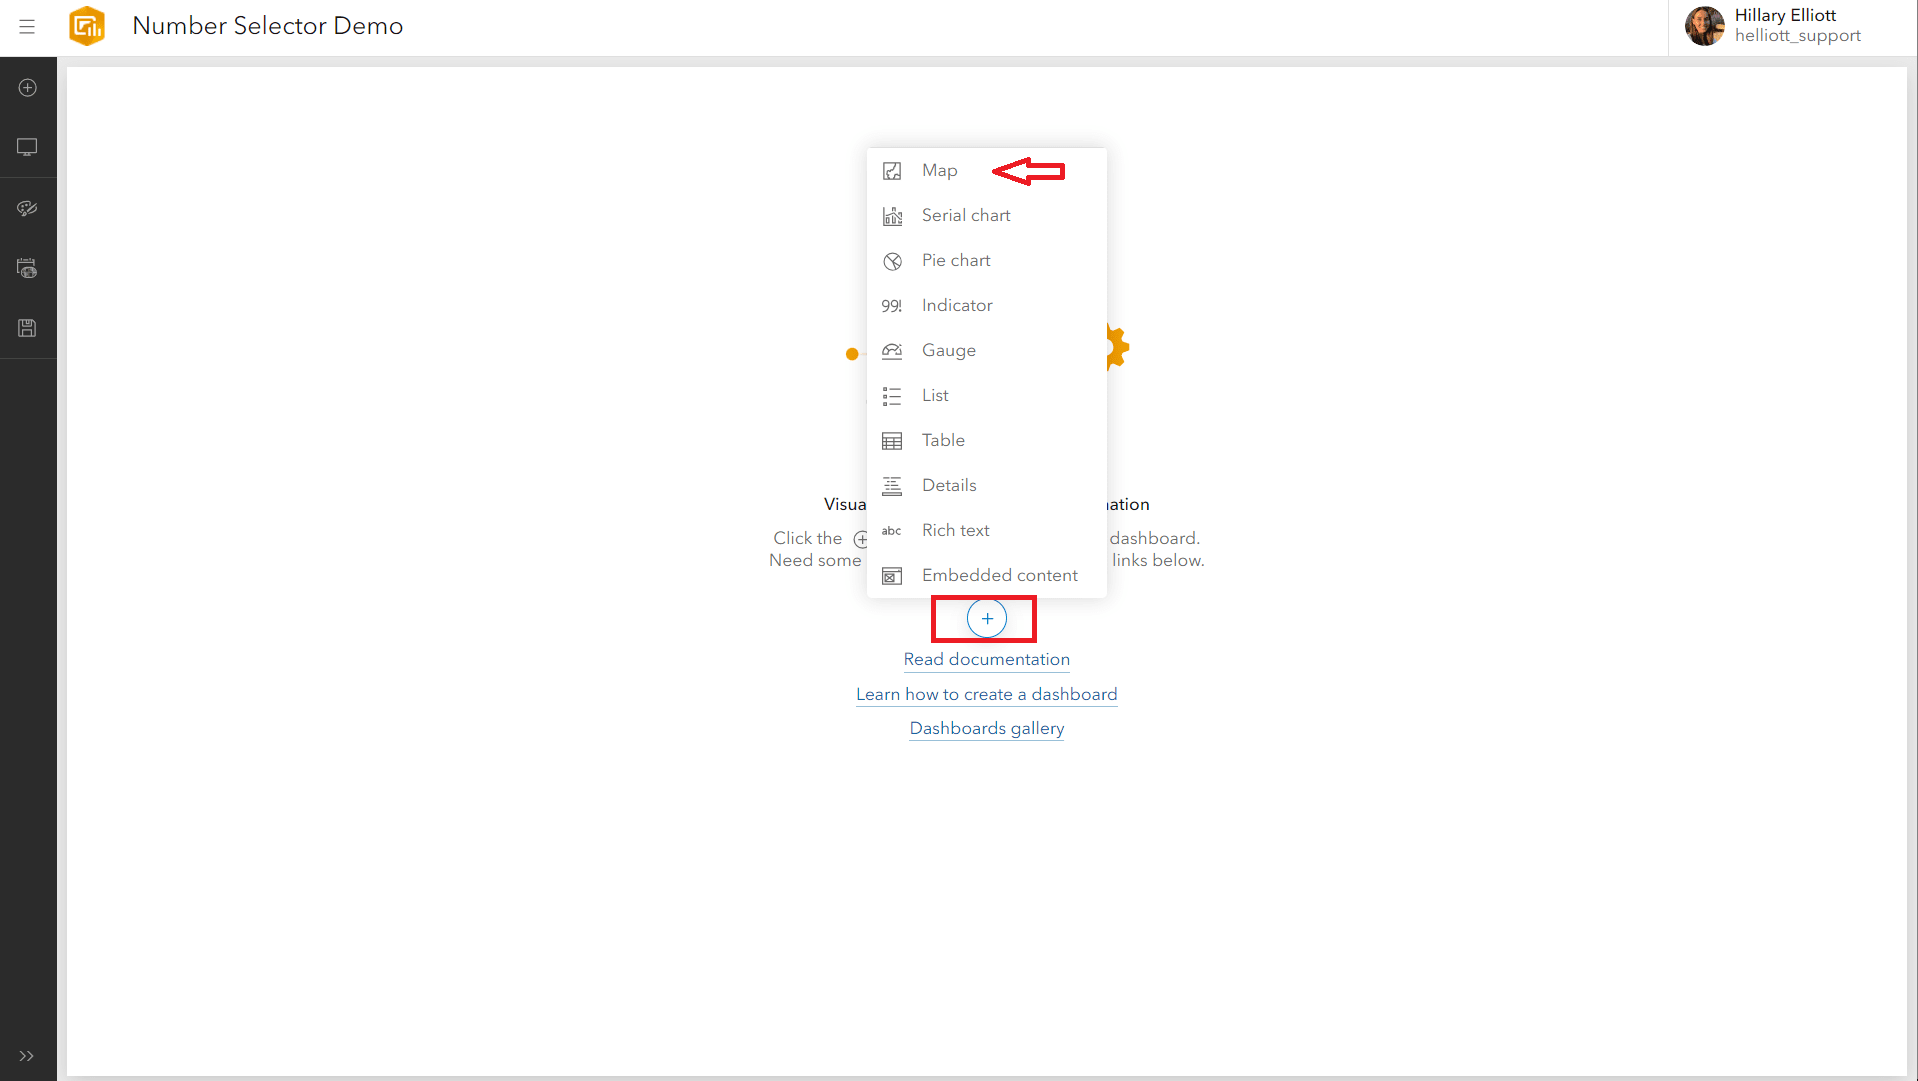
Initial view of setting up the Dashboard
Initial view of setting up the Dashboard
To effectively filter your data using number selectors, start by ensuring that the necessary layers are included in your web map. For this example, we will focus on two layers: one for inspection reports of research stations and another for weather monitoring stations. Each of these layers must contain a field of the number type, which will hold the values you want to filter by—specifically, scores from the inspections.
By confirming that your layers are properly set up with the appropriate number-type fields, you will be ready to implement filters that enhance user interaction and allow for a more dynamic exploration of your data on the dashboard.
-
Add a Sidebar
Navigate to your dashboard, and if it does not have one already, add either a sidebar or a header. For this example, we will add a sidebar.
NOTE: A selector can only be added to the header and sidebar in the desktop view and to the drawer in the mobile view. These include the category, number and date selectors.
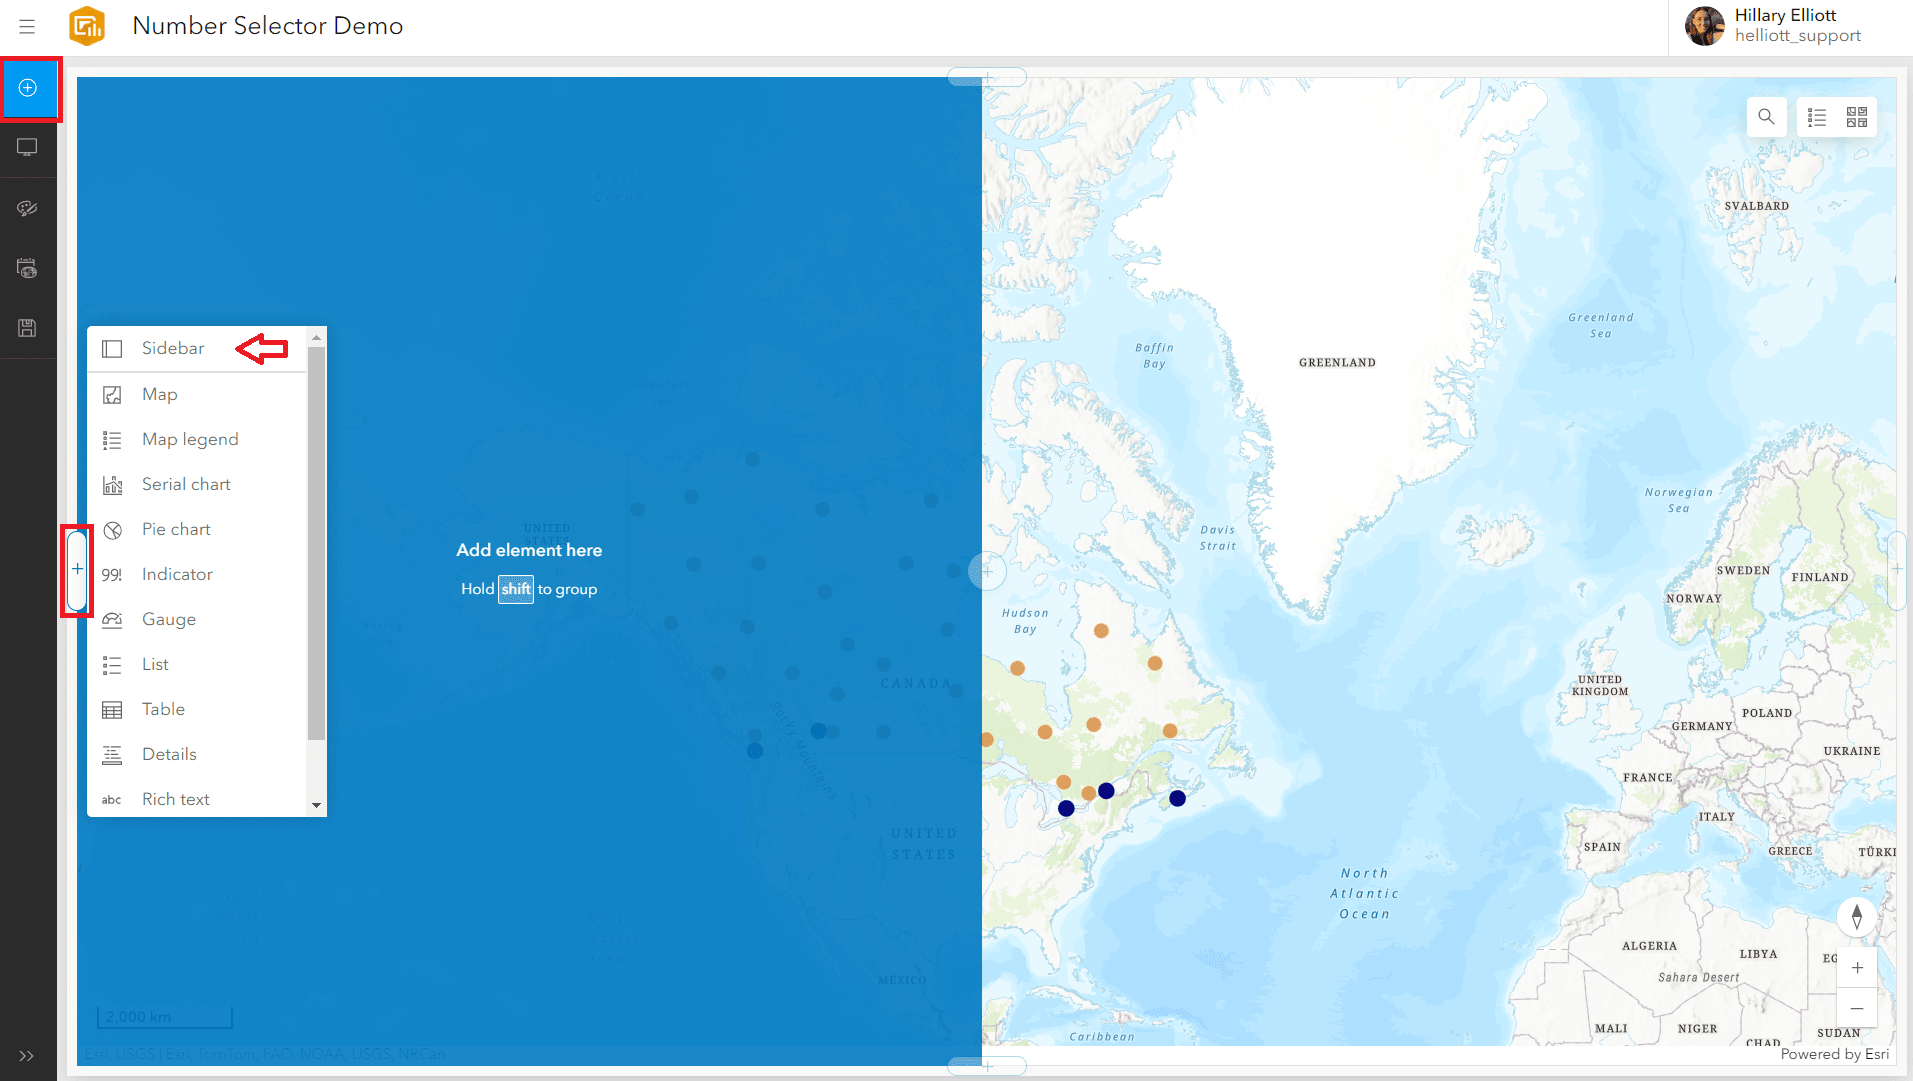
Using the plus sign from the View pane to add a Sidebar
-
Configure the Sidebar
Within the General tab of the sidebar settings, you can give it a title, description, set the text color and foreground color and optionally configure the sidebar to be a collapsible pane.
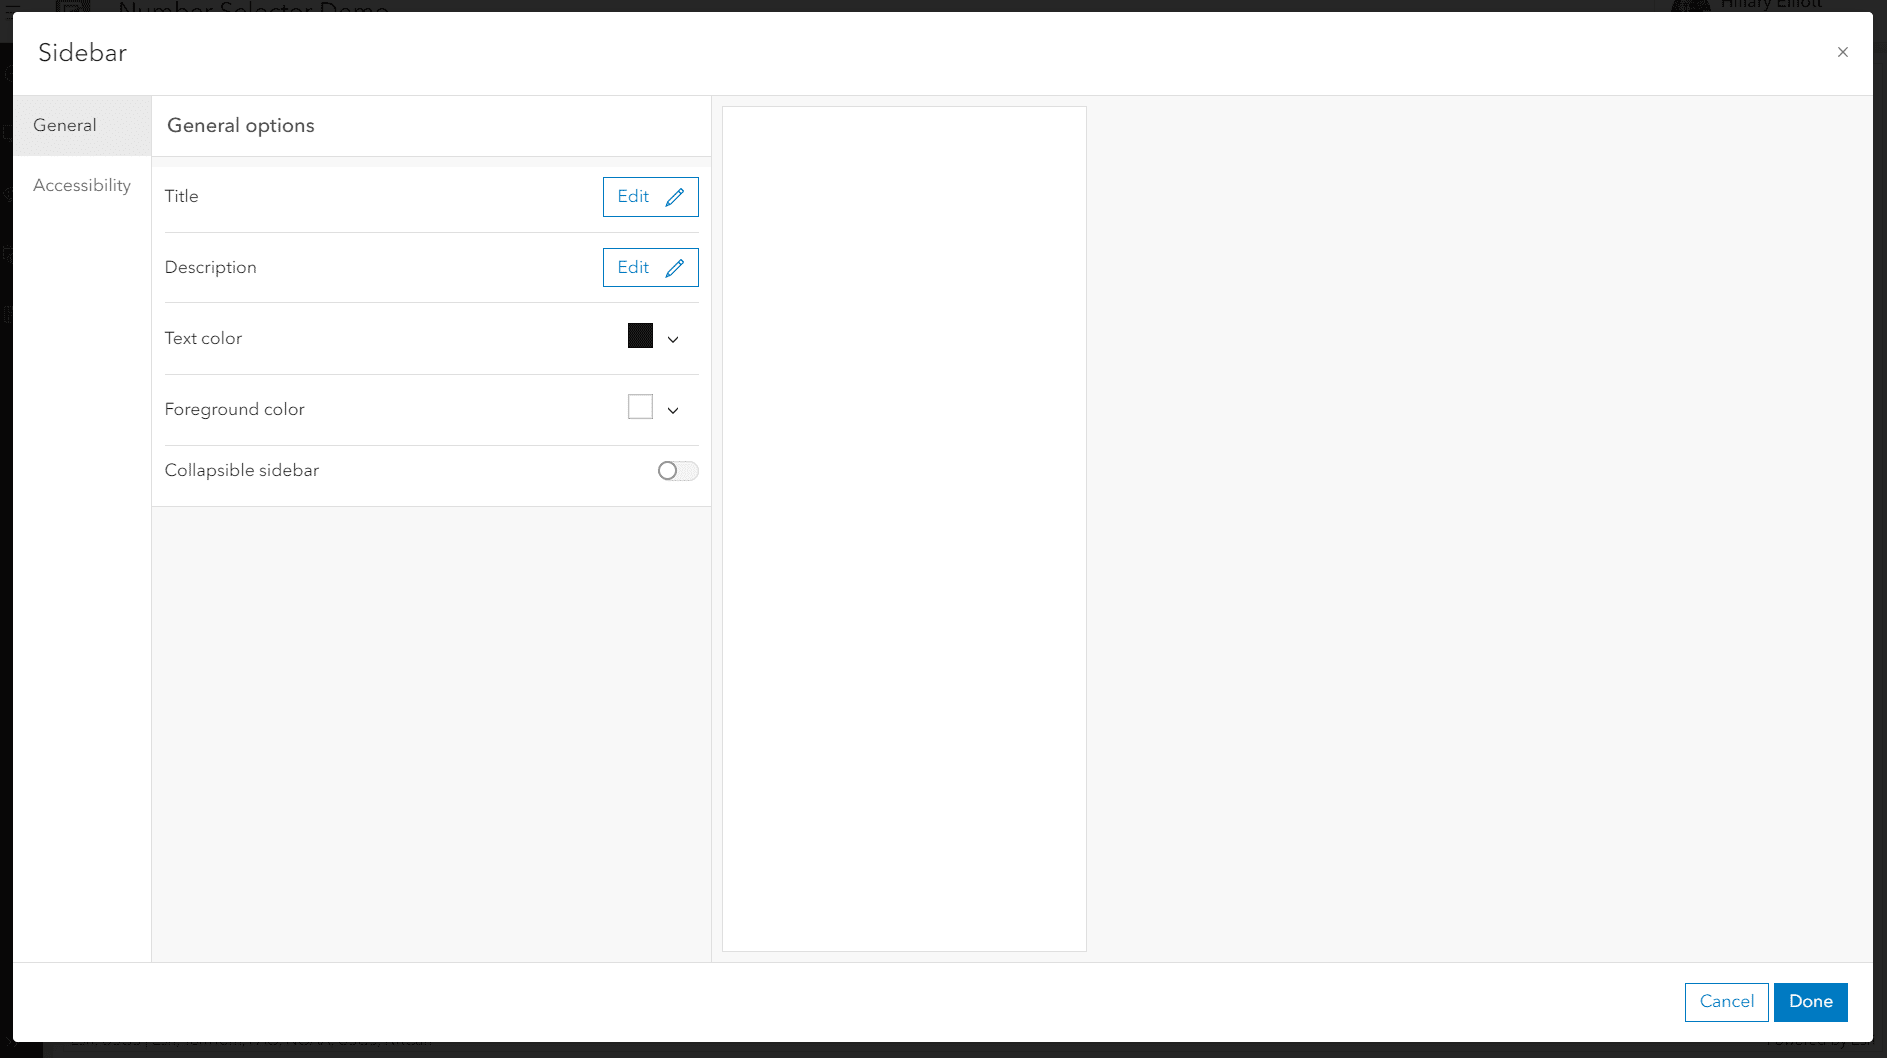
Sidebar general settings
Adding an accessible name in the Accessibility tab would help ensure the application is usable by everyone. This enhancement can make a significant difference in user experience!
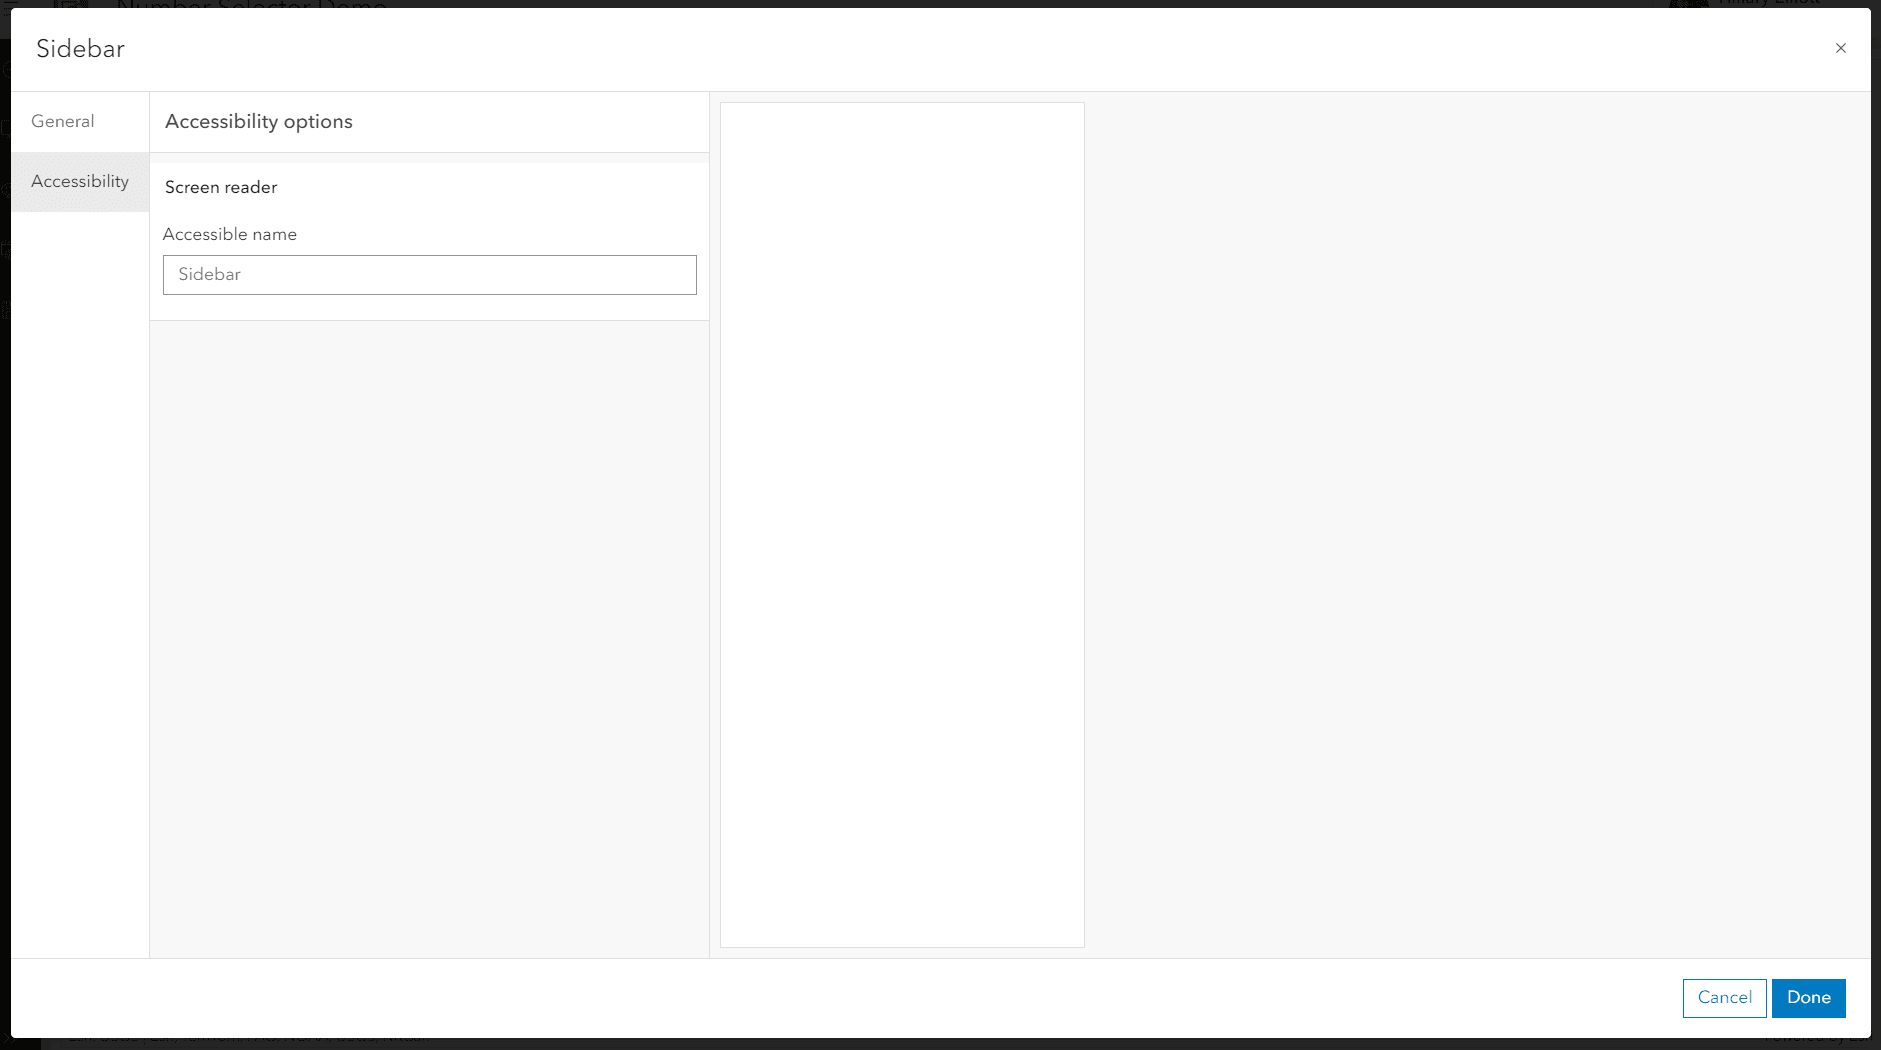
Sidebar accessibility settings
Click Done to save your edits.
TIP: Once you close the sidebar settings, you can always reopen it by hovering over the three dots of the sidebar and clicking on the settings icon.
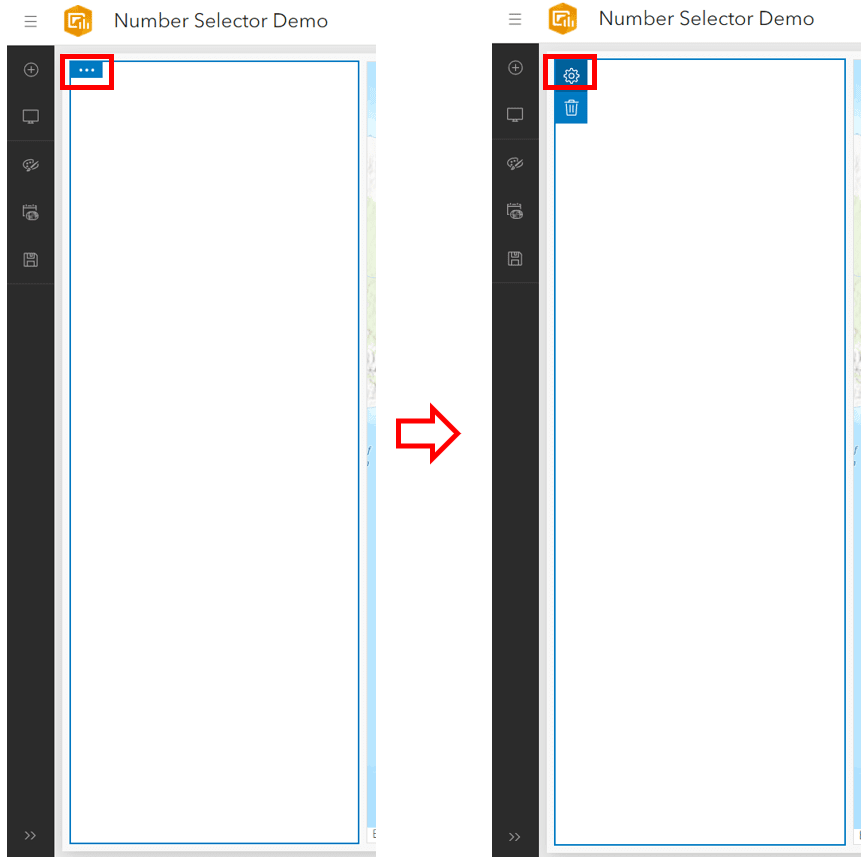
Hovering over the 3 dots to get the sidebar settings icon to appear
Setting up the number selector
-
Add the Number Selector
-
Click on the ‘Add element’ button from the View pane on the left-hand side.
-
Add the element to the sidebar from the previous step.
-
Choose the number selector.
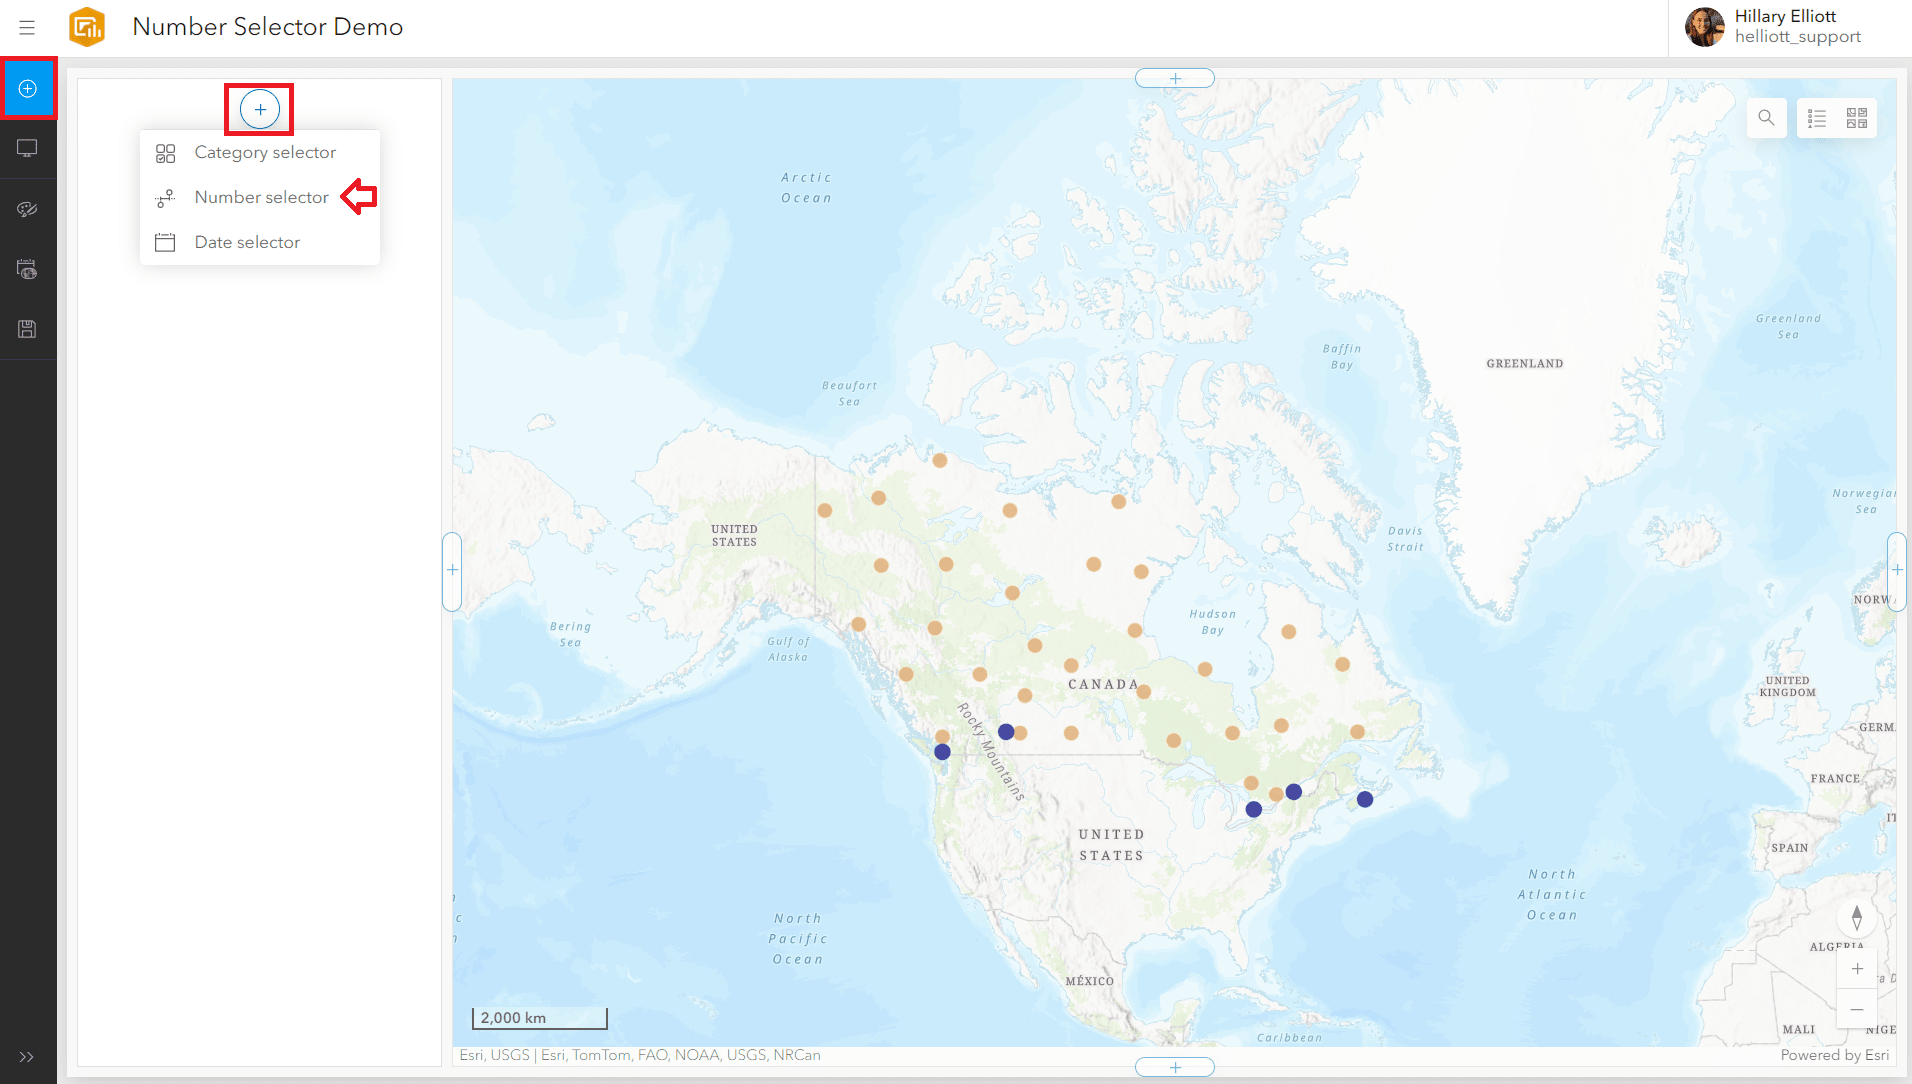
Using the plus sign from the Sidebar to add a number selector
- Configure the Selector
Give the number selector a label and configure the rest of the settings. For this example, we will choose ‘Range’ as the input type and we will enable the option to reset and clear the selector.
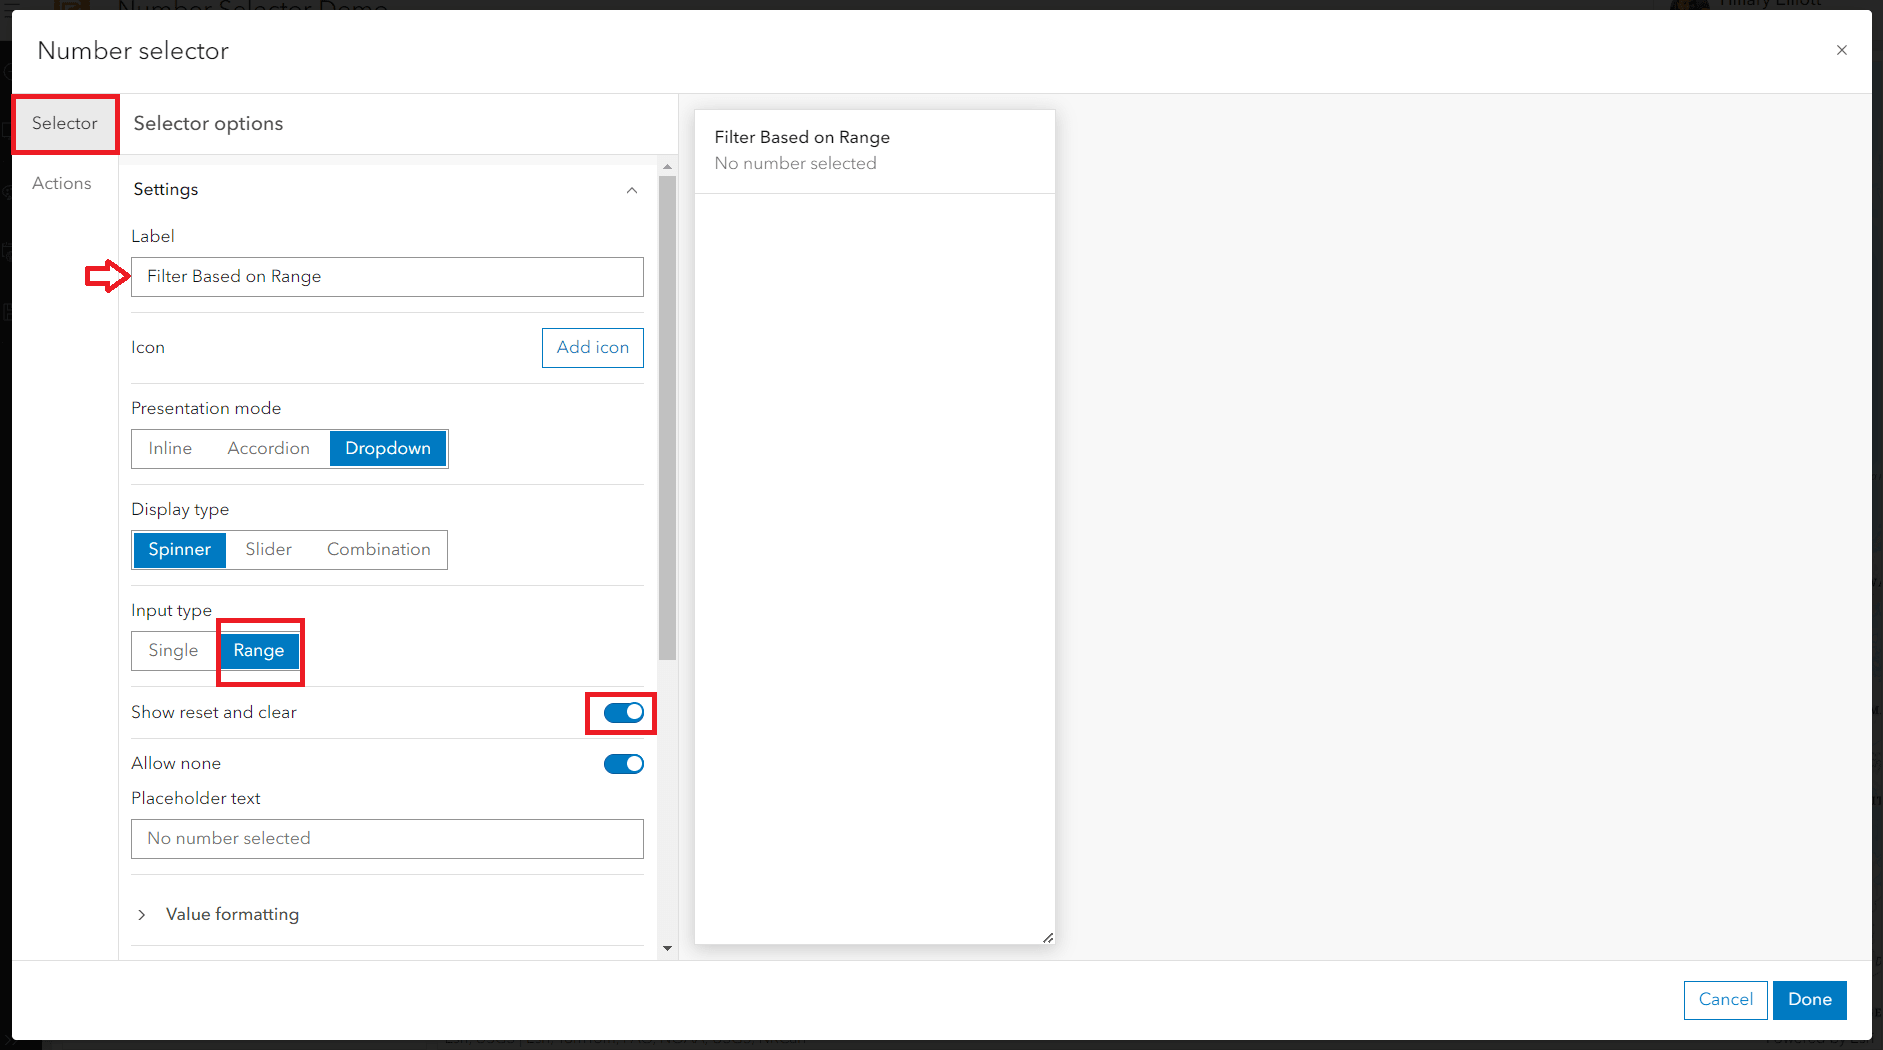
Number selector settings
You may click on the value formatting drop-down arrow and configure the style, decimal places and other formatting parameters. For this example, we will stick with the defaults.
Scroll down to finish setting up the range of values the number selector will use to filter. For this example, we will use a range of 0-15 and an increment of 1.
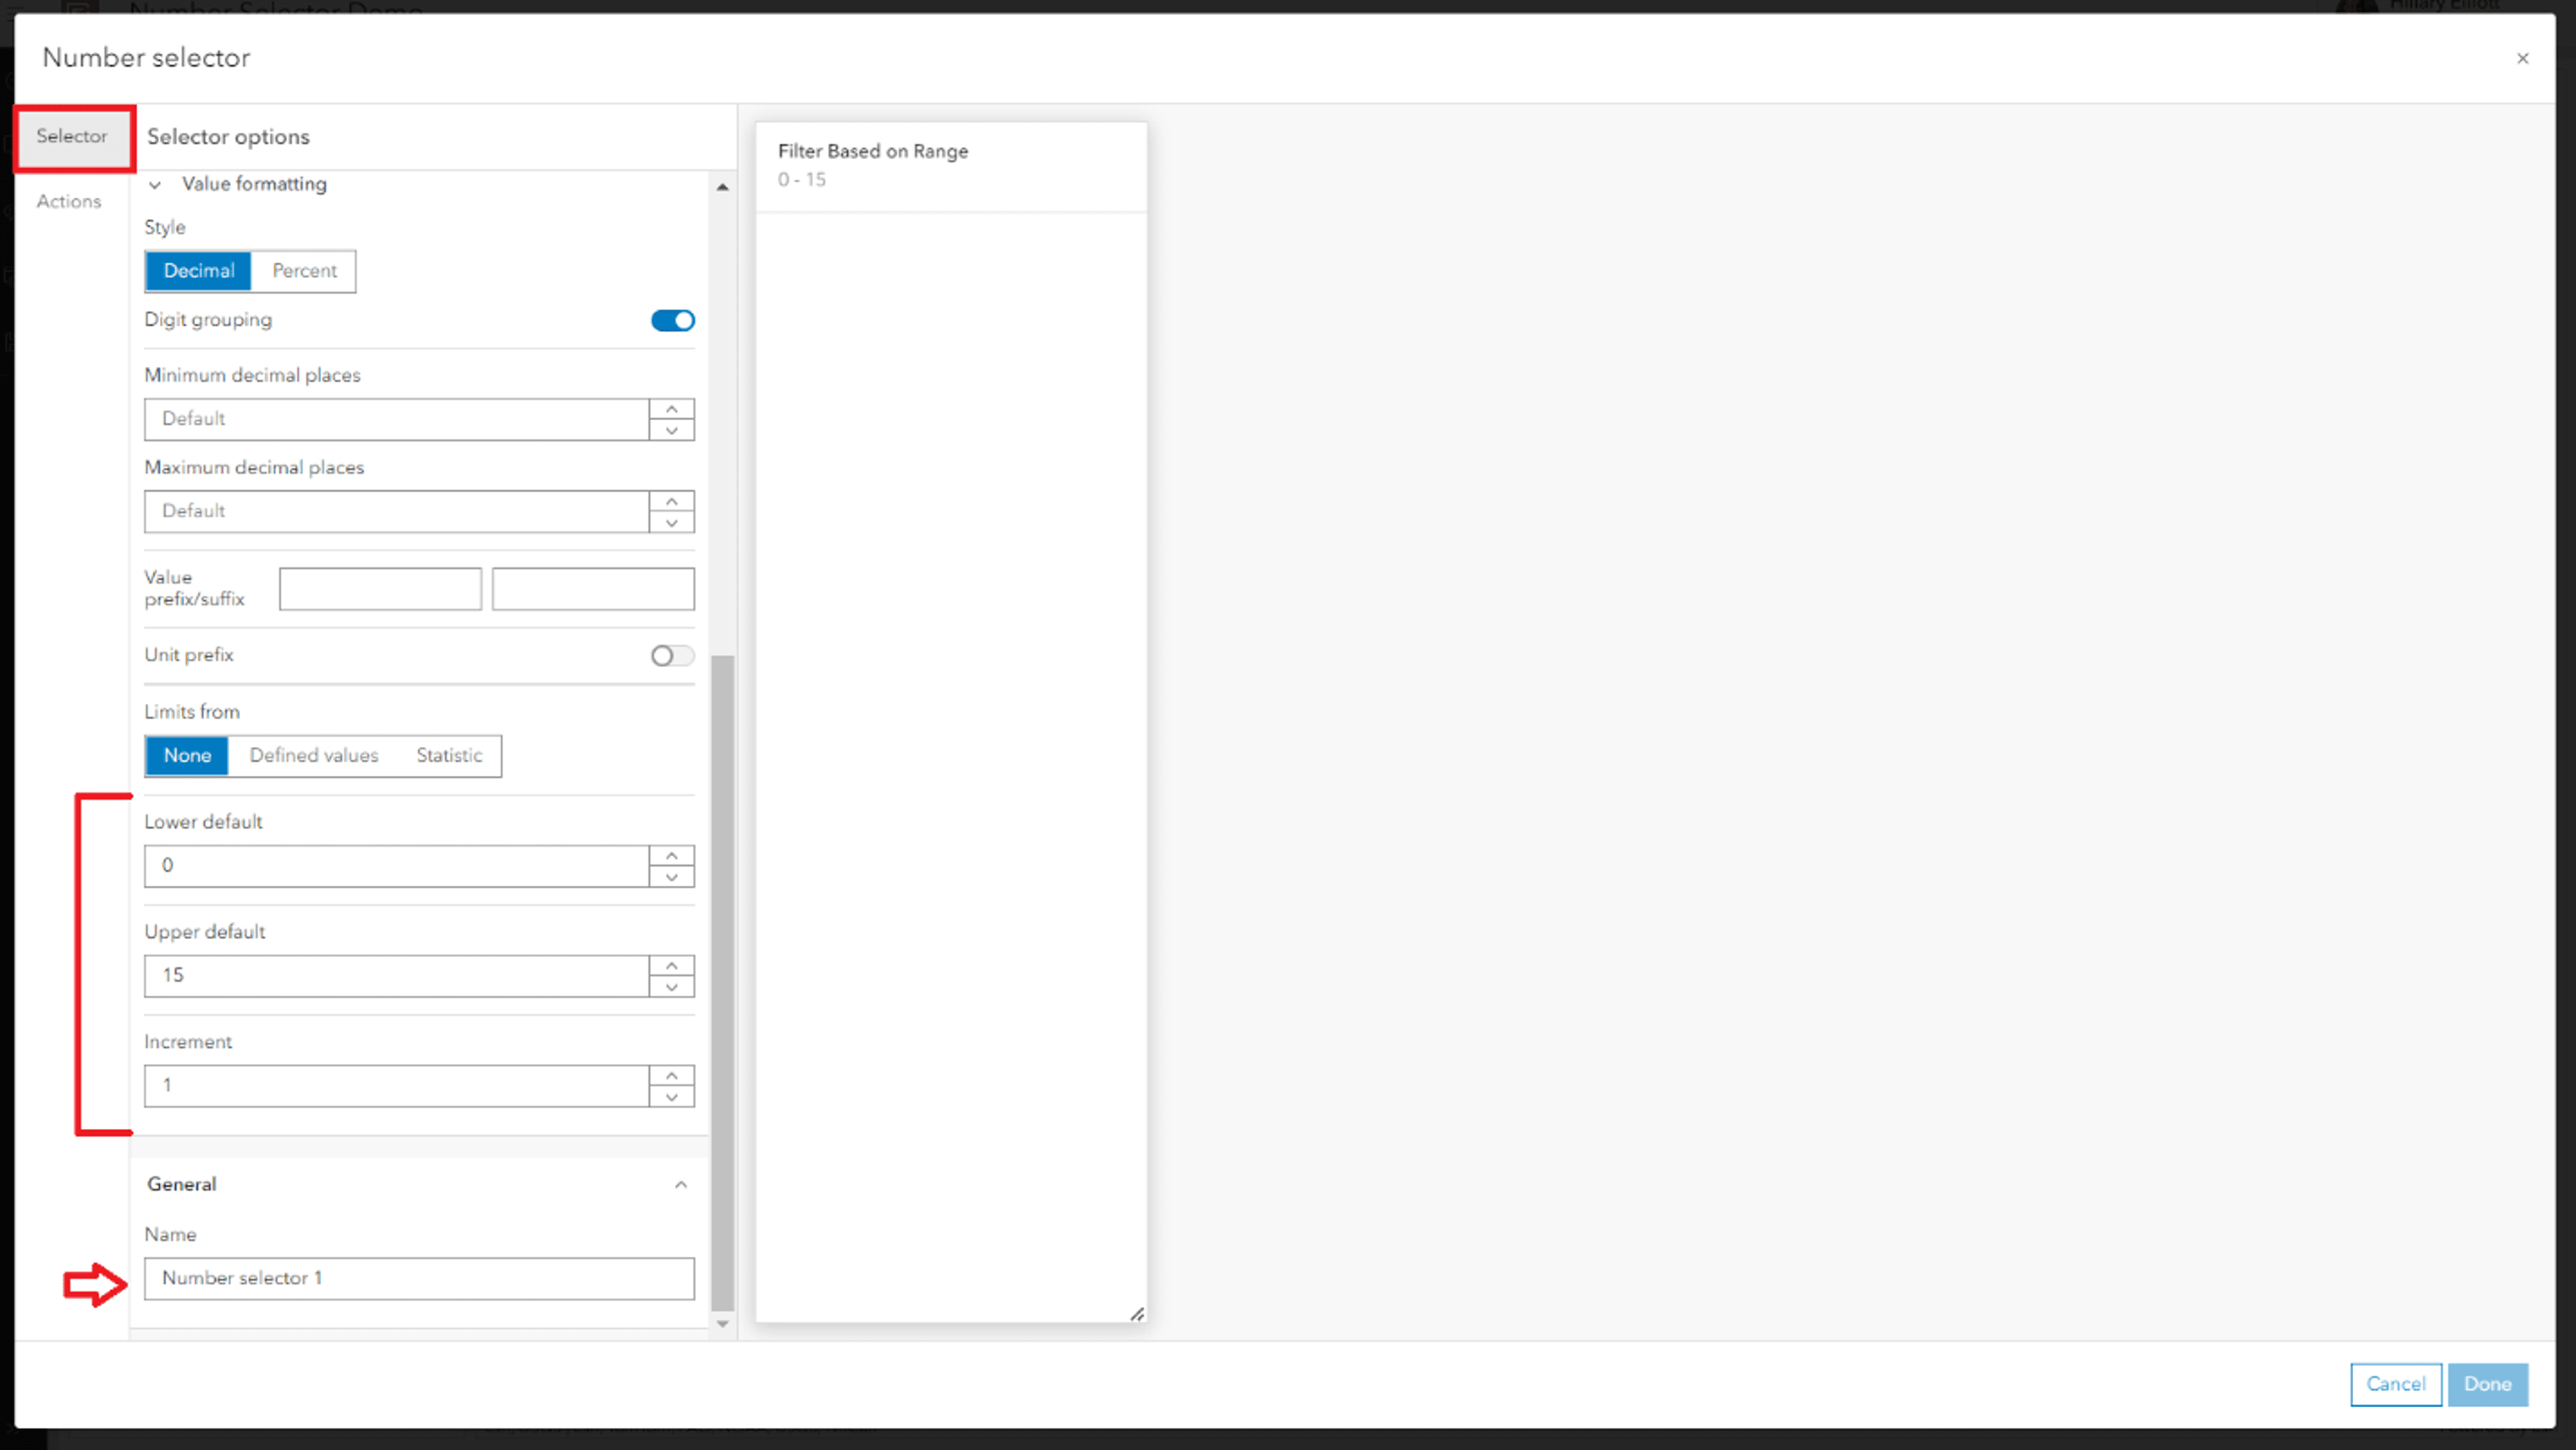
Setting the range of values in the number selector settings
-
Set Up Actions
-
Next, open the Actions tab.
-
Enable each layer you want the number selector to filter. For this example, we will not enable the “Render only when filtered” option.
-
Choose a field for each layer that will be used to filter the range of values.
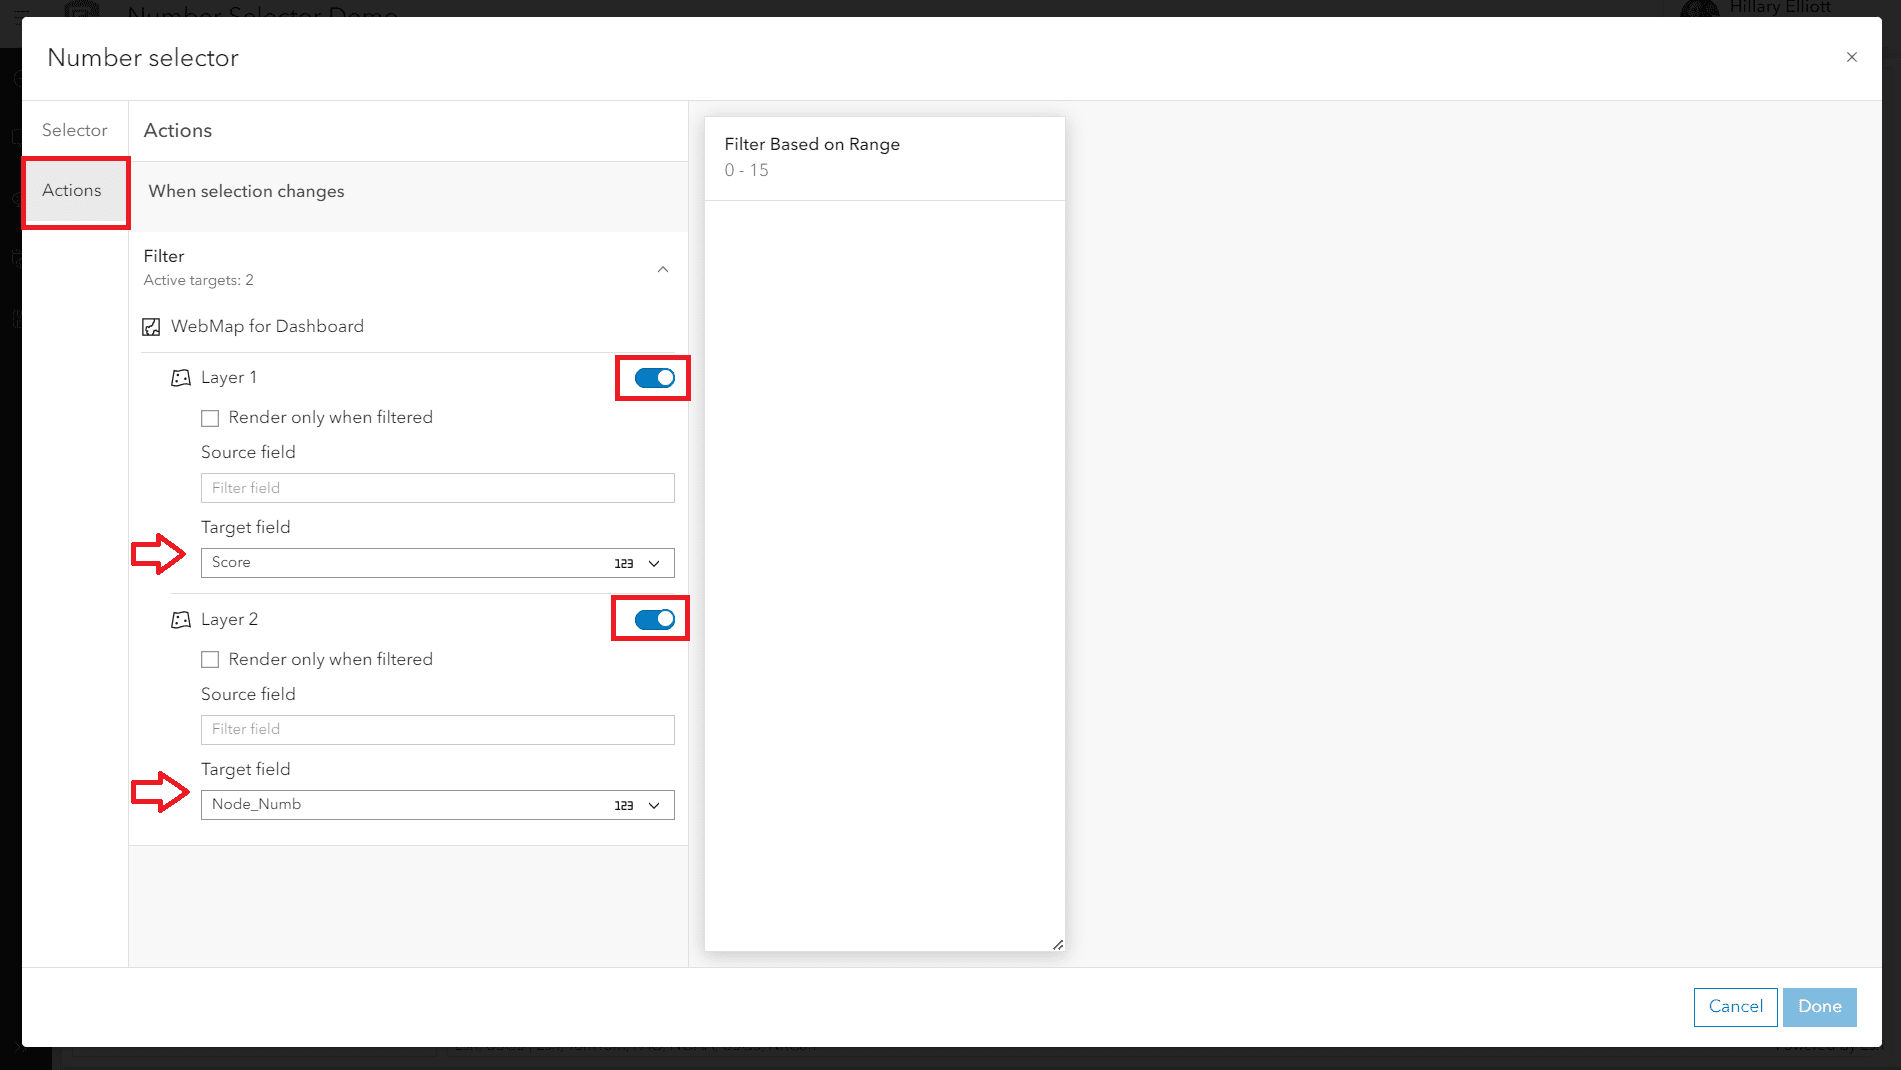
Actions settings of the number selector
Click Done to save the number selector.
TIP: Once you close the number selector settings, you can always reopen it by hovering over the three dots of the selector and clicking on the settings icon.
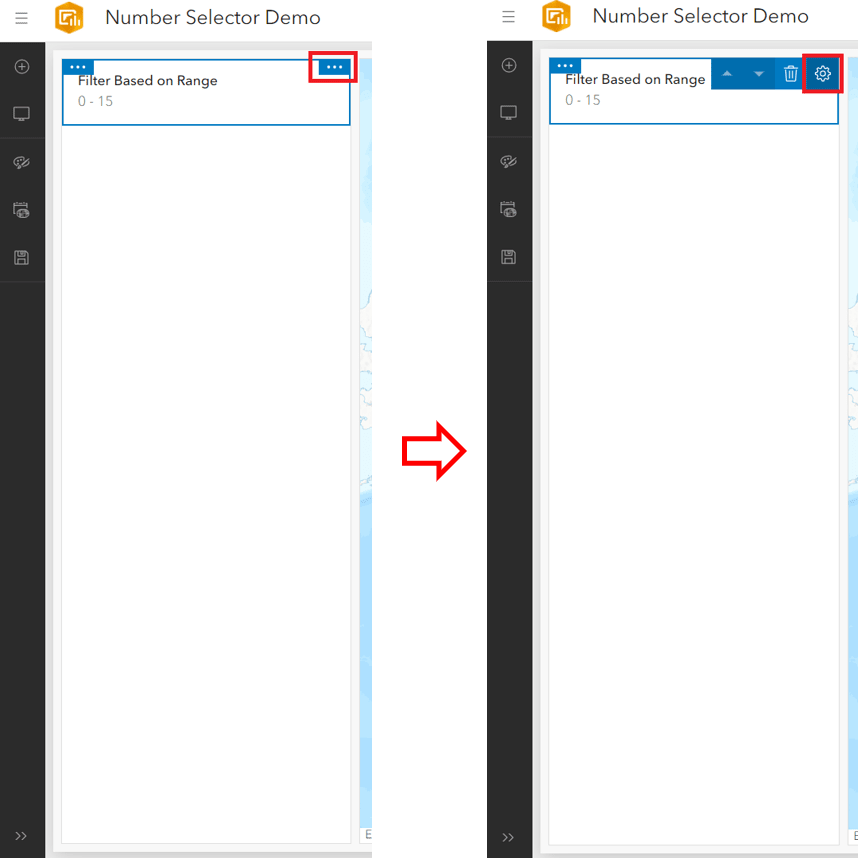
Hovering over the 3 dots to get the number selector settings icon to appear
-
Results
Finally, you can view the dashboard and see the results of the number selector filtering the two layers based on the specified fields with a range of 0-15. Thus, only the features that have a value between 0-15 are displayed.

Results showing the number selector only displaying features that have a value between 0-15 from the specified fields
Because we enabled the option to reset and clear the selector in step 2 of ‘setting up the number selector’, we can clear the filter and see all the features.
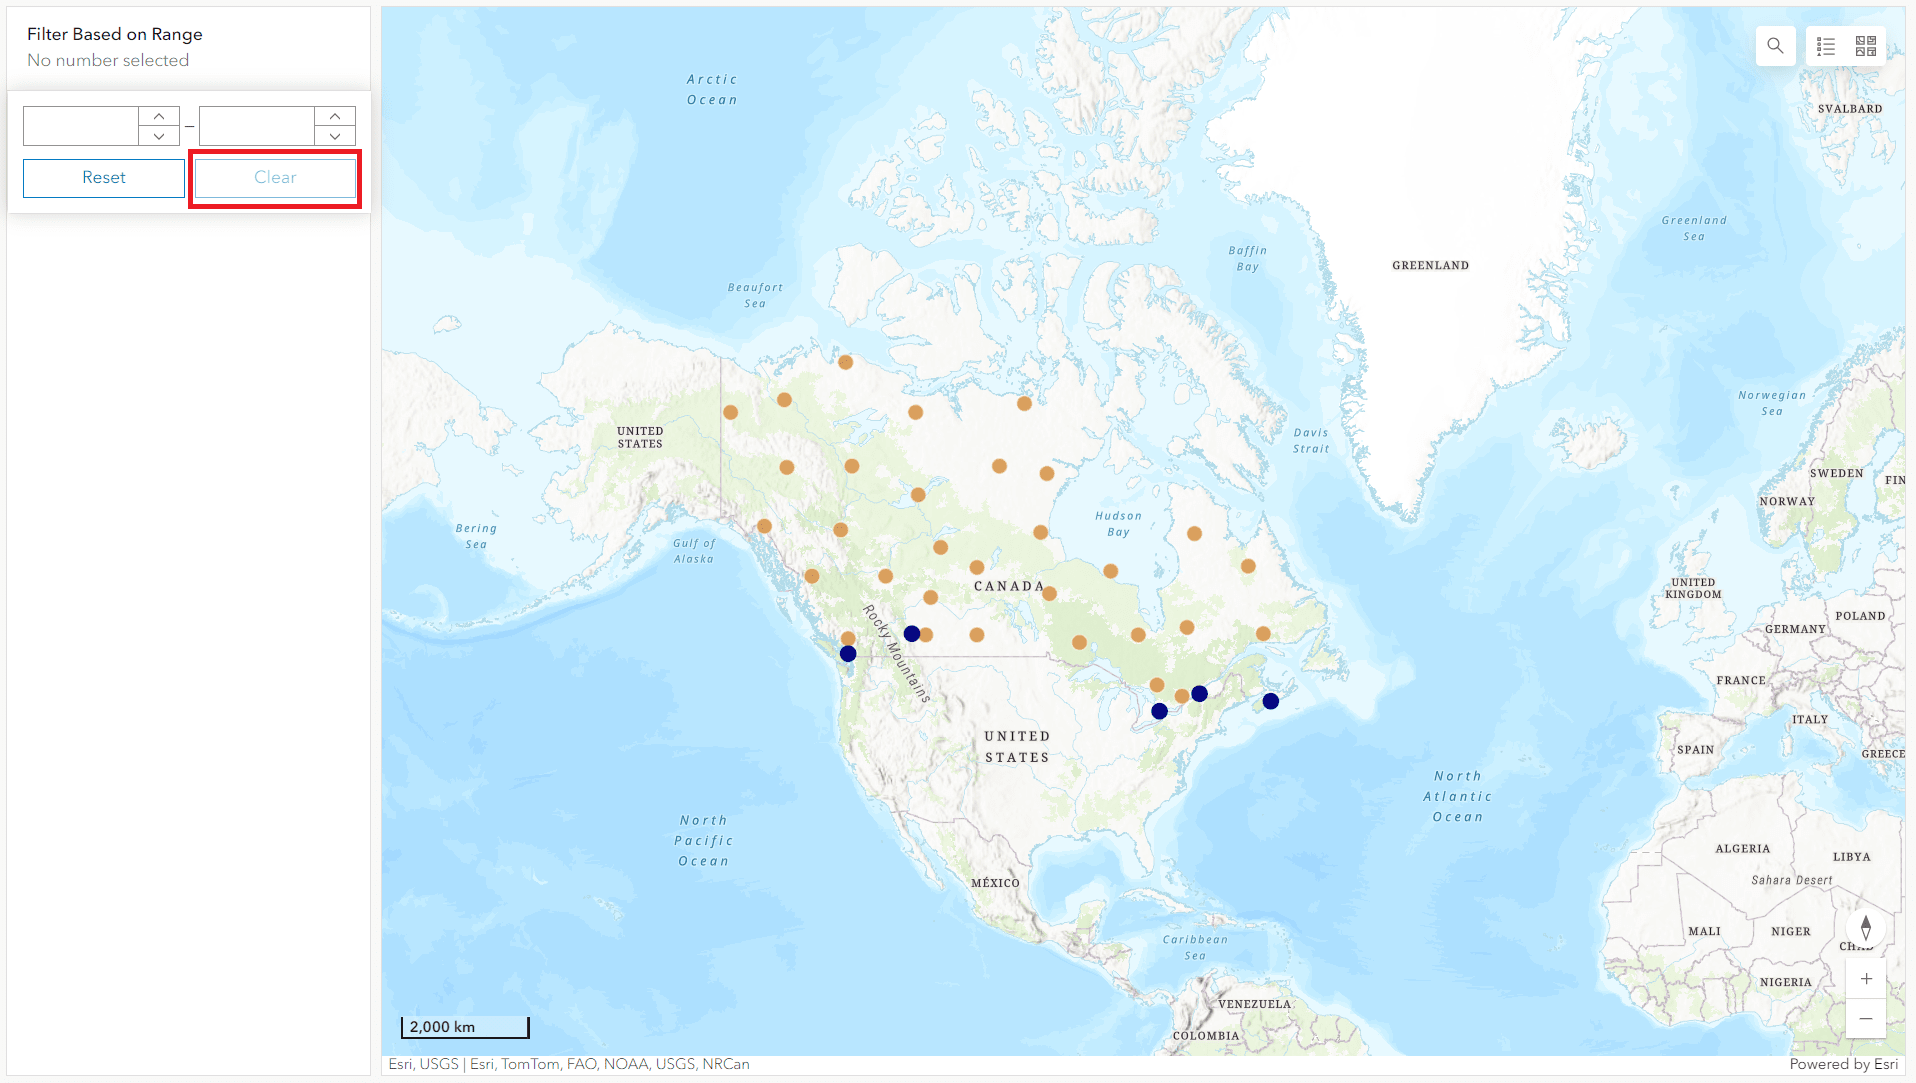
Clearing the number selector which clears the filter, so all features displayed
Conclusion
The number selector in ArcGIS Dashboards is a powerful tool for filtering data. Configuring it to filter multiple layers allows users to build dynamic and interactive dashboards that provide valuable insights into your spatial data.