On the map with Zinta Amoliņš
Zinta Amoliņš, a French teacher in Ontario, studied Voltaire's Candide: or, All for the Best with her students using geographic information systems (GIS).
Zinta Amoliņš teaches French at École secondaire catholique Renaissance (in Aurora, Ontario). She may surprise you with a project where she has leveraged GIS in her French language classes! Using GIS in primary and secondary education is often associated with social sciences, particularly geography or even natural sciences, since it is ideal for collecting, analyzing and communicating data. However, the versatility of GIS makes it possible to create relevant projects for students in almost any discipline. Zinta's project is a prime example.
Zinta Amoliņš teaches French at École secondaire catholique Renaissance in Aurora, north of Toronto.
Zinta was introduced to GIS by her sister, my colleague Krista Amolins, who talked to her about this technology several years ago. At the time, she thought the technology was very interesting and inspiring, but she also found it complicated to use and did not see any good use cases for her students. As time has passed, the technology has evolved to offer many more accessible and easy-to-use options for non-GIS professionals.
Zinta, what has led to you introducing GIS to your students?
I was looking for an innovative project to give to my students. My initial thought was to trace the locations of the novel on a global map, just as an exploratory and review activity. Then I had a “flash” of inspiration and thought it would be even more interesting to let the students explore with technical tools and make a cumulative assessment of it.
What were the students required to do for this project?
In studying Voltaire's Candide: or, All for the Best, the students were asked to identify a theme by showing how it was presented in each of the places visited by the main character. They were asked to note the characters, the narrative outline, the symbols, the dialogue, etc., in connection with the theme. By creating story maps with ArcGIS StoryMaps, the students saw how the theme evolved through the novel in relation to particular places, and how the place contributed to understanding the theme.
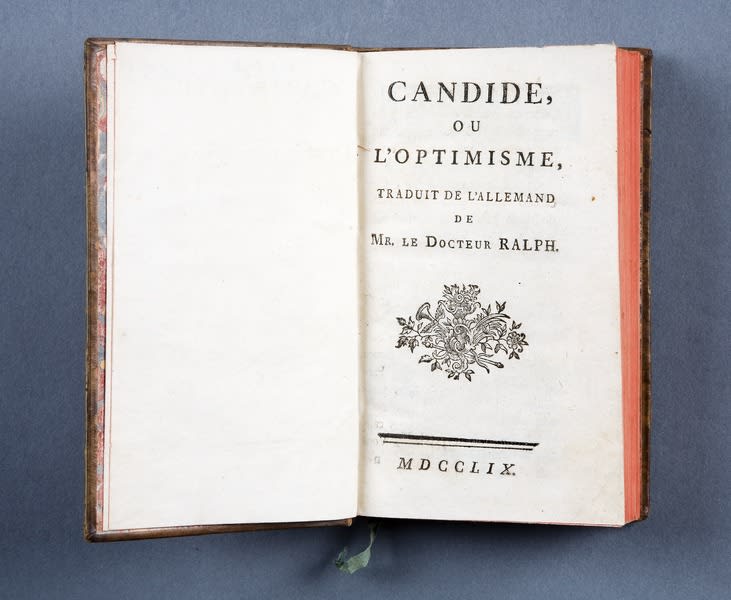
Candide: or, All for the Best (1759)
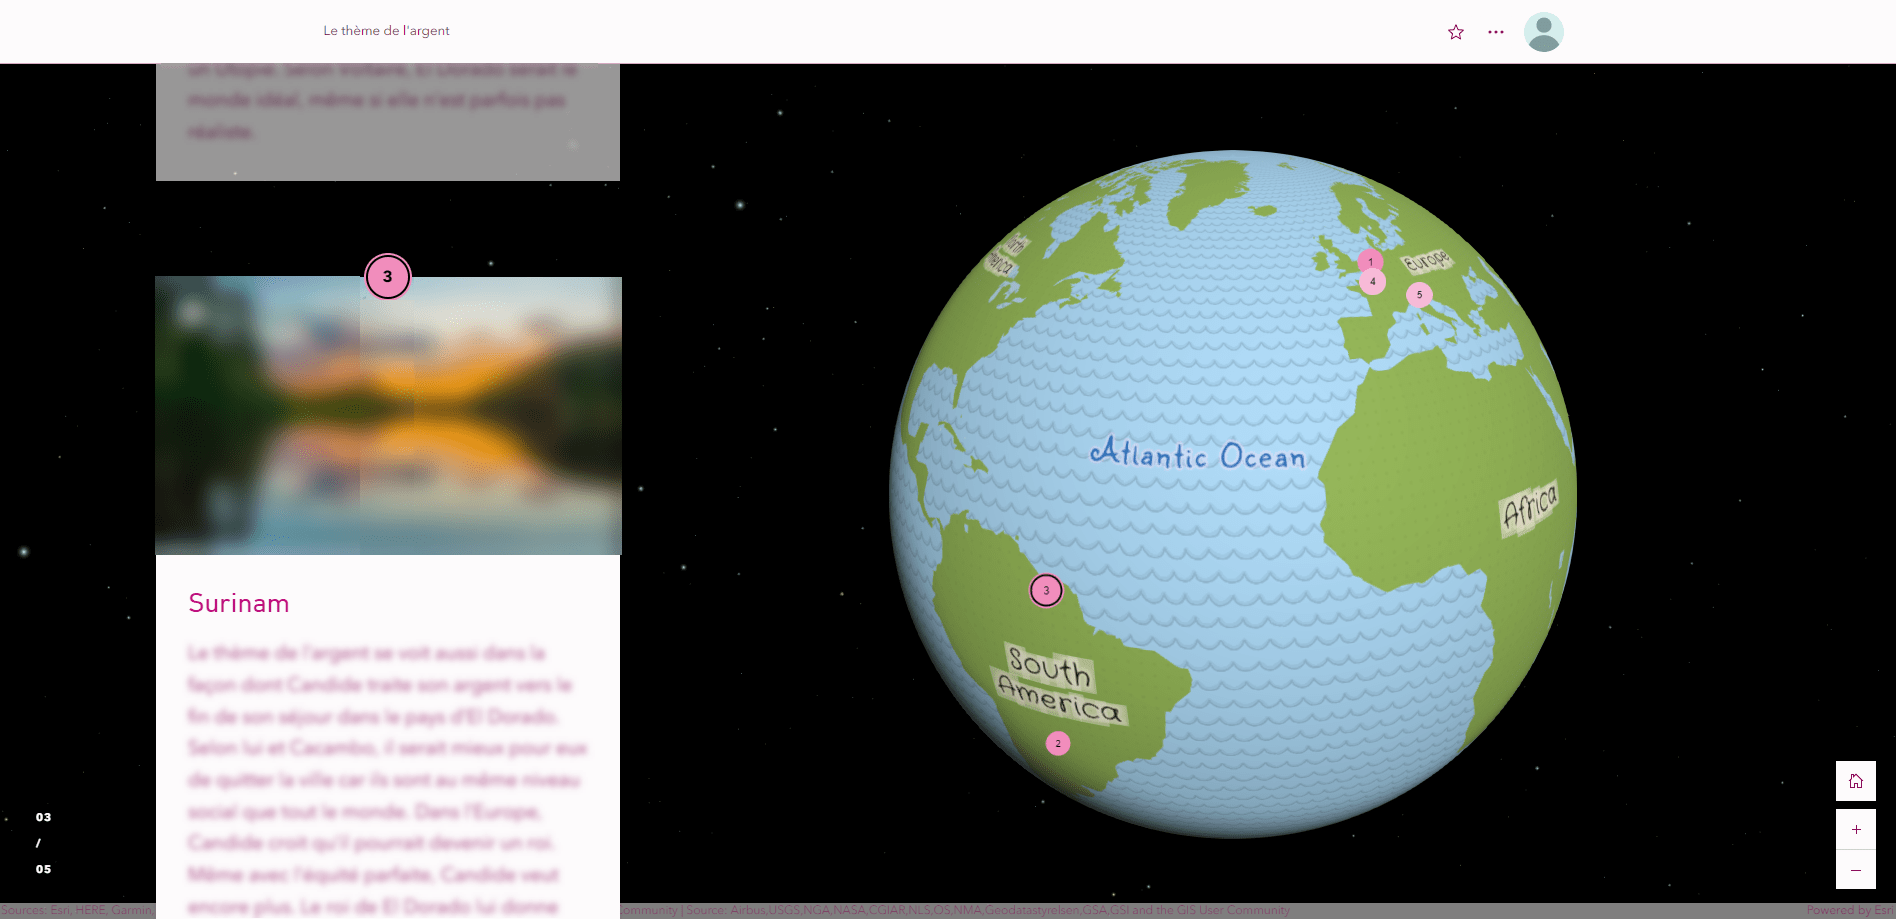
Example of a student’s story map.
Which elements of the program were covered and what teaching methods did you use with this project?
I used mostly modeling/demo, but also the collaborative approach and hands-on learning. Several elements of the Ontario Ministry of Education curriculum were covered in this project.
Reading:
- Identify explicit and implicit information in texts.
- Establish parallels between areas of interest and skills as well as the themes of the texts read.
Writing:
- When collecting information, consider areas of interest and skills to deal with certain aspects in written work.
- Use in writing the knowledge of languages and text learned in information and communication technologies.
As the students in this group are also completing the International Baccalaureate (IB) program, the project covered expectations specific to this program.
- Know, understand and interpret elements related to literary, stylistic, rhetorical, visual and/or representational processes.
- Analyze and evaluate the ways in which texts offer perspectives on human concerns.
- Communicate using a variety of styles and records, for different purposes and in different situations.
At which educational level(s) was this project aimed?
I used it with the grade 12 students, but I will do it again with other classes. I only teach grades 11 and 12, but I can easily envision how we could also use it with grade 9 and 10 students.
How did the students react throughout the project?
The students found the concept and the technology very cool. Some went further to create their own theme or to add other elements. They really liked the idea of using story maps for other projects (personal or academic). I promised to keep our group open so that they can use it and share with the class group. My students wanted to make story maps for school trips that they go on. Although there was a lack of time, I saw their enthusiasm for the future.
Going forward, how do you envision your use of GIS and the use of these tools by your colleagues?
It’s a new tool under my belt. If other opportunities come up, I’m in! I was also able to present the ArcGIS Online platform to my department and to other colleagues at the school. Some of them have already used it in their classes. Everybody finds the idea interesting and inspiring, but not everybody has the time or the energy to innovate and include technology.
We thank Zinta for speaking with us about her use of GIS with her students! We look forward to seeing how she will evolve in the years to come.
Your toolbox
We are always available to answer your questions, to guide you and to support you with your projects. Write to us at k12@esri.ca.
If you wish to start on your GIS adventure, visit our website to obtain free access for you and your students: k12.esri.ca.
For more activity ideas and a wide range of resources, visit our K12 Resource Finder.
This post was written in French by Arabelle Sauvé and can be viewed here.