Better Planning Bigger Impact Peel Region Smart Water Wastewater Network
Peel Region uses a geographic information system (GIS) to pinpoint and prioritize repairs on aging infrastructure, forecast spending and improve service delivery. GIS is transforming Peel’s water and wastewater management for smarter, more effective planning.
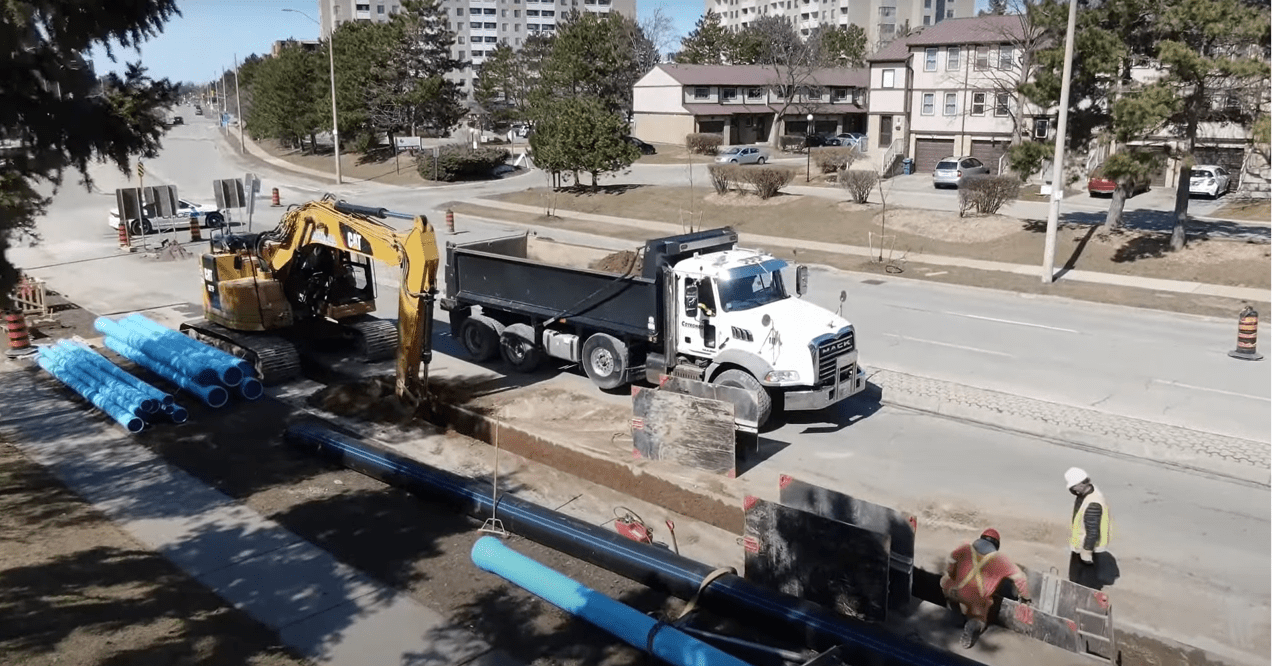
Peel Region watermain replacement
Balancing growth and infrastructure
Serving 1.5 million residents across Brampton, Mississauga and Caledon, Peel Region manages the second-largest water and wastewater system in Ontario. With a growing population and aging infrastructure, strategic planning is crucial.
Anil Agnihotri, Advisor Analytics – Water and Wastewater Program Planning, Public Works at Peel Region, emphasizes the importance of identifying factors like asset age, material type and environmental conditions in long-term planning. These critical variables determine maintenance needs and predict scheduling replacements. GIS tools are central to this process, enabling better decision-making and long-term service reliability.
Challenge: overcoming infrastructure management hurdles
Natural wear and tear on assets increases risk leading to service interruptions and failures. Identifying high-risk assets to manage while staying within budget was at the heart of the struggle. Manual spreadsheet-based analysis lacked the spatial insights needed to see patterns, predict issues and optimize resource allocation. And construction updates were shared as single static PDF maps. This ad hoc approach focused on individual assets or small areas, rather than providing a holistic approach, which examines the entire infrastructure network.
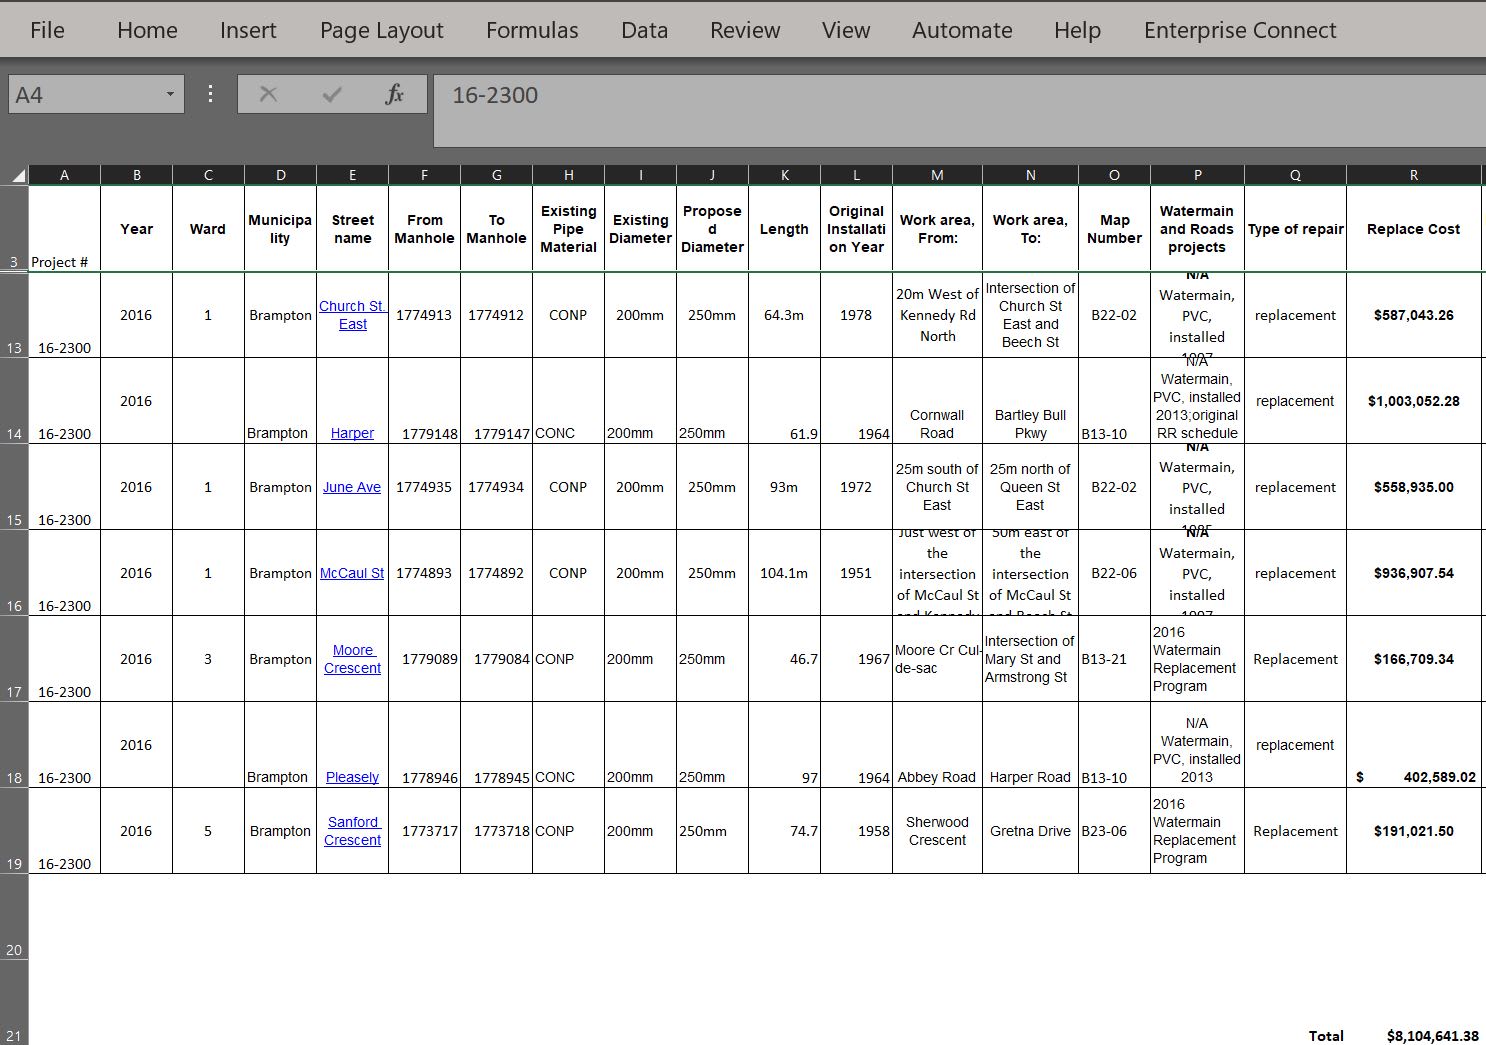
Peel Region internal planning spreadsheet: watermain and road projects, data captured manually (2016)

Peel Region construction work communicated with individual PDFs (2015)
Additionally, the data was fragmented and scattered across various systems and departments, making it difficult to gain a comprehensive view of infrastructure needs. This lack of centralized information complicated the ability to pinpoint where repairs were most urgent and how to allocate resources effectively. Recognizing the need for change, Peel Region implemented its own GIS solution to tackle these issues directly.
"ArcGIS Online centralizes all our asset data, from pipe material to failure history, so we can access it anytime and share it with different teams for better collaboration."
- Anil Agnihotri, Advisor Analytics - Water and Wastewater Program Planning, Public Works, Peel Region
Solution: integrating data for smarter planning
The Decision Support System (DSS) was designed to integrate multiple data sources into a unified environment, enabling real-time decision-making. The system prioritizes repairs using condition scores based on performance, forecasts spending and supports State of Good Repair (SOGR) planning. ArcGIS Online centralizes the data, improves prioritization and resource allocation and reduces costly failures.
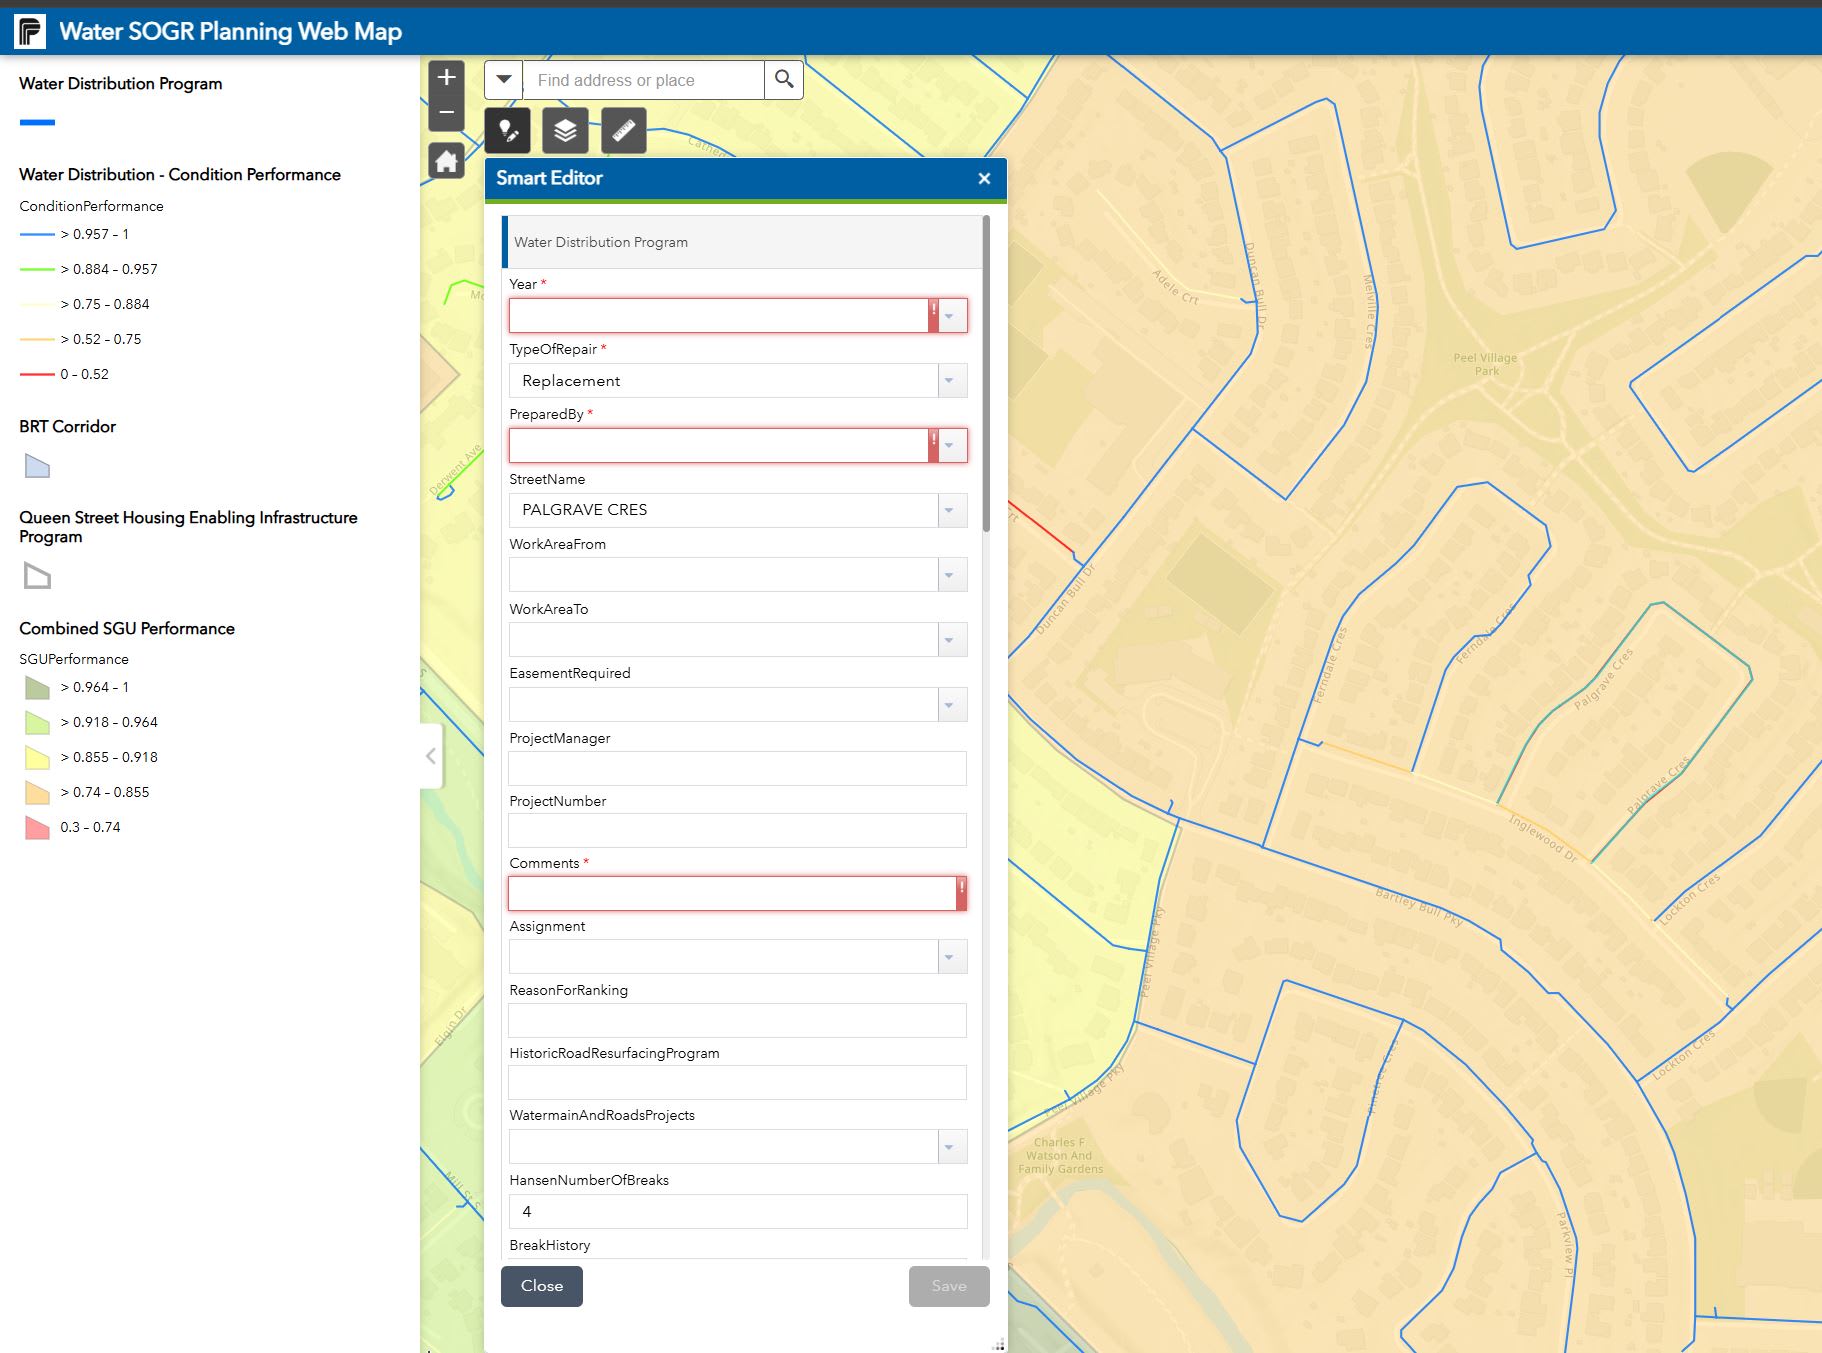
DSS Intervention planning data entry - Identifying infrastructure for intervention like repair and replacement

DSS results – Combined water and wastewater corridor performance
Key DSS workflows include:
- Unified data environment: ArcGIS Online integrates data from departments like asset management and maintenance, providing real-time, accessible information for all decision-makers.
- Statistical analysis: Using the Weibull statistical curve, DSS predicts asset failure timelines, offering insights into longevity and repair needs so that interventions can be planned accordingly.
- Smart Editor widget: Helps planners allocate budgets, view the impact and adjust plans dynamically.
- Capital Projects Web Map: Provides real-time updates on Peel Region infrastructure projects, including roads, water and wastewater construction and is publicly accessible.
This shift from reactive to proactive planning has optimized resources and minimized risks, improving both service delivery and transparency.
Region of Peel Capital Projects Web Map showing planned infrastructure work
Results: improved efficiency and preventative maintenance
Peel Region GIS adoption has transformed asset management. Aligning priorities with fiscal realities has delivered several benefits, enhancing both operational efficiency and service to residents.
Accurate forecasting and scenario planning - GIS tools help Peel Region predict repairs and replacements with precision, allowing planners to test budgets and scenarios before committing resources. This ensures timely action, effective interventions and a clear understanding of asset conditions and service life.
Streamlined communication and accountability - An interactive web map provides real-time updates on construction projects, keeping residents informed and engaged. This transparency builds trust while ensuring decisions align with community needs and expectations.
Extended asset lifespan and adaptability - Optimized maintenance scheduling reduces unnecessary replacements and improves emergency response, saving time and money. This approach extends infrastructure lifespan and ensures flexibility for future challenges without compromising long-term goals.
All planning results are consolidated in a Companion Dashboard, providing users with a clear view of the location and cost summary for each intervention activity. The dashboard enables real-time filtering and analysis of past, present and future programs, offering a comprehensive tool for planning and decision-making. Peel Region GIS-driven approach creates a more resilient and sustainable water and wastewater network, supporting growth and fostering innovation.
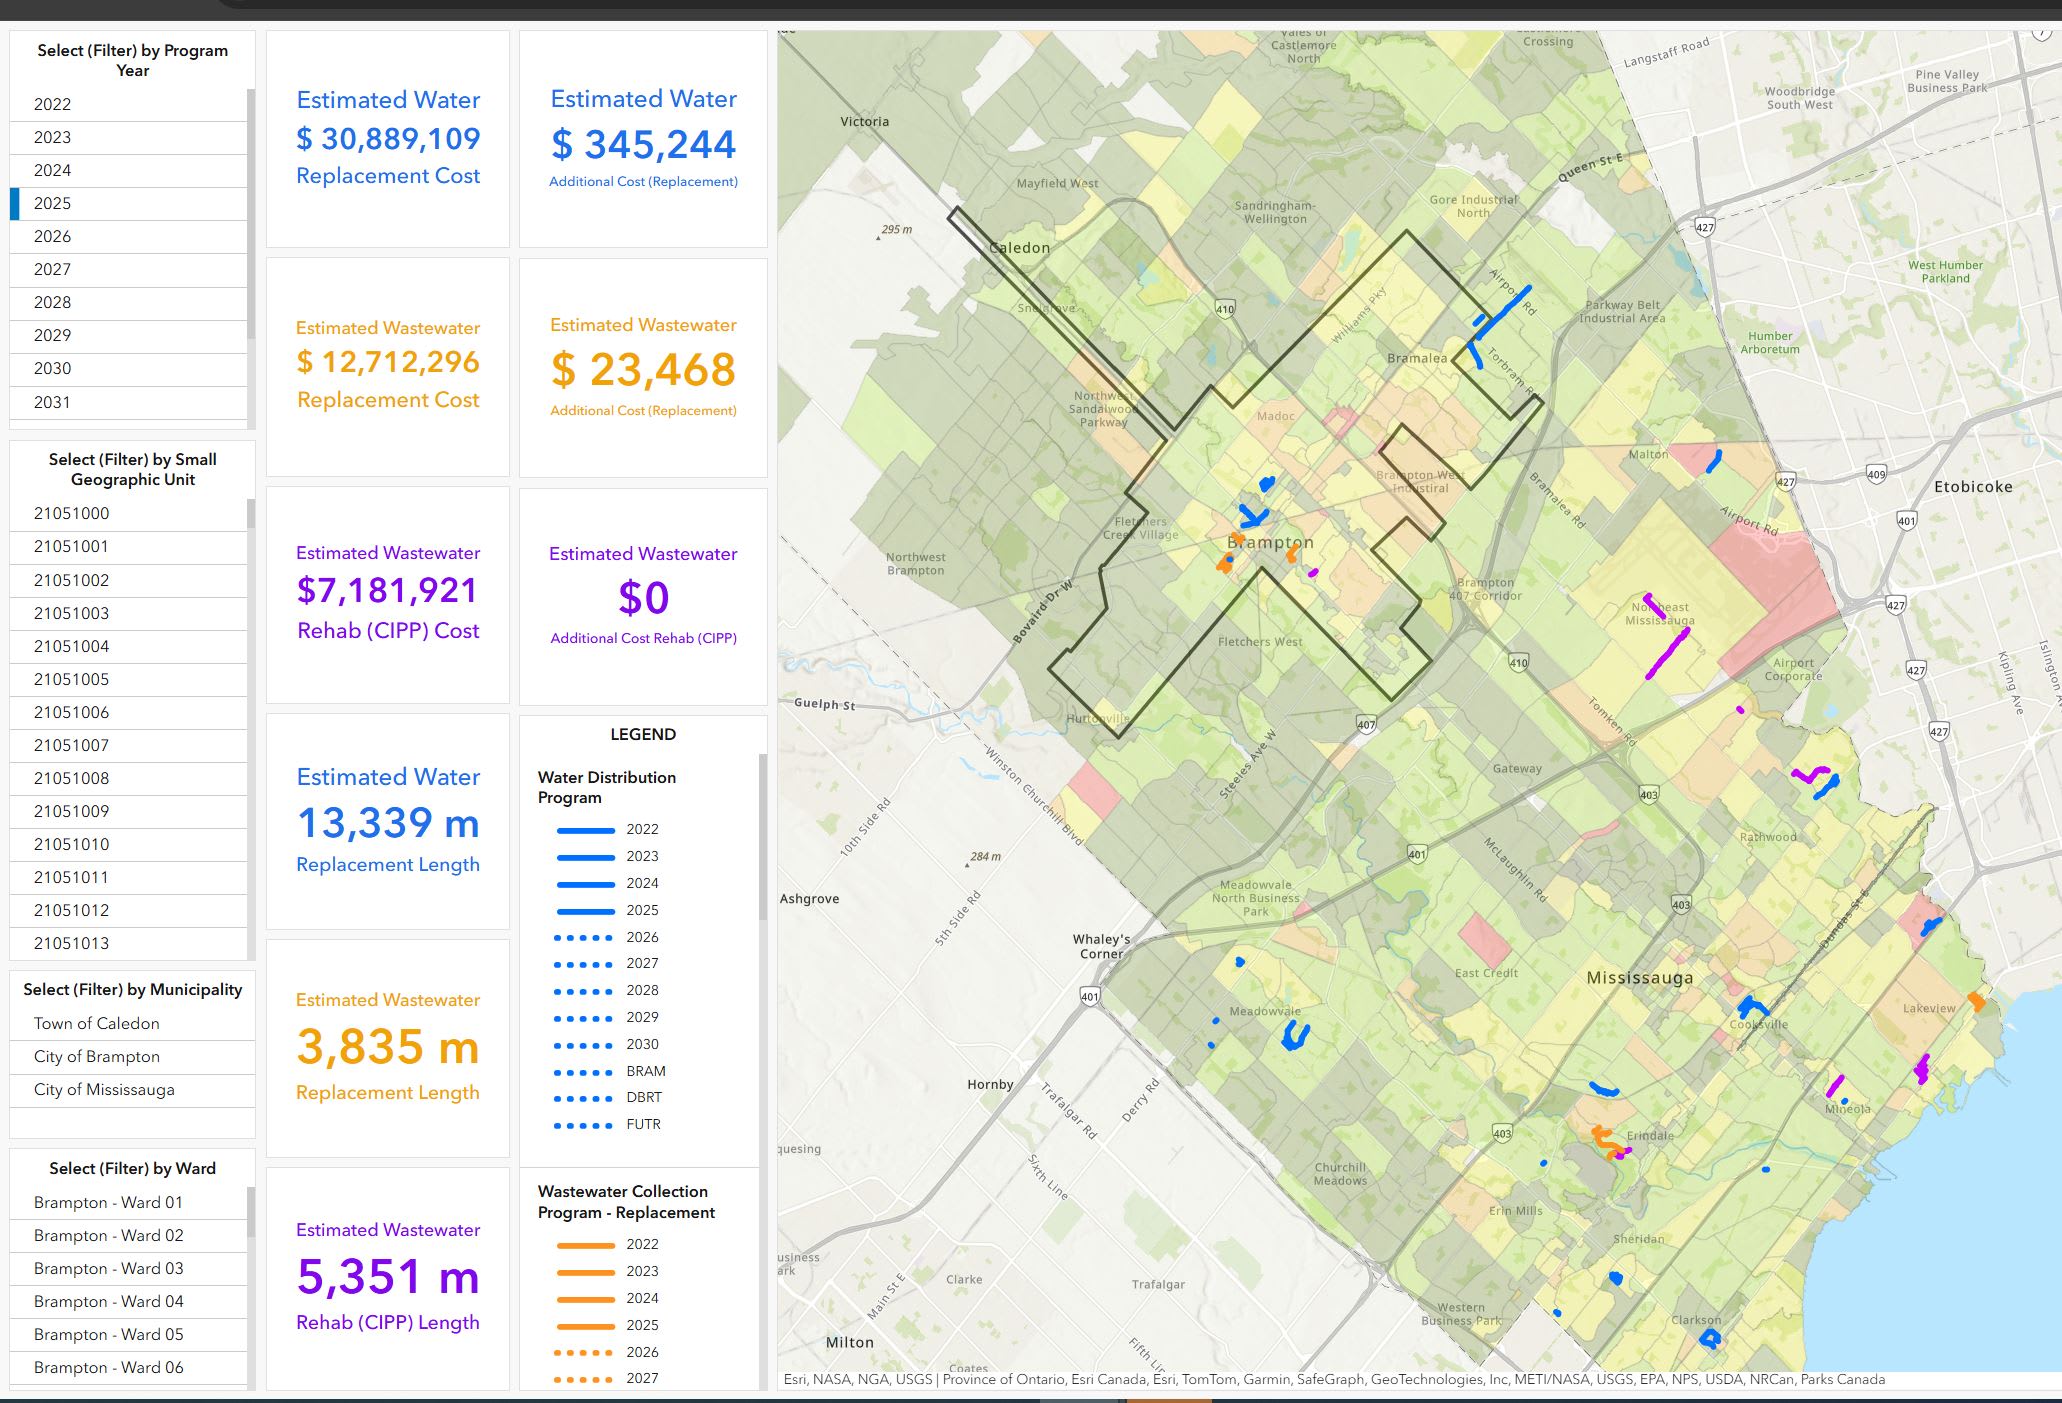
DSS Intervention planning – ArcGIS Companion Dashboard: sharing the overall 2025 plan
Shaping tomorrow: smarter public works planning
To support predictive and scenario-based planning, Peel Region is integrating more data sources and expanding dashboard features, focusing on water and wastewater management. This will improve infrastructure resilience and service quality while supporting regional collaboration with Mississauga, Brampton and Caledon. Special projects, such as planning a new light rail transit corridor like the Dundas Bus Rapid Transit System, demonstrate the adaptability of its GIS tools in aligning infrastructure with future growth. Peel Region is using GIS to plan smarter, improve resource use and ensure reliable, sustainable infrastructure for the future.
Questions? Contact us at esri.ca/water
Learn how water utilities strengthen asset management and optimize decision-making with GIS: resources.esri.ca/water Reach out to Armando LaCivita, Director, Utilities.
For a deeper dive into the DSS system, learn from Peel Region’s 2024 GIS Day presentation with Anil Agnihotri.