App of the Month: Long-Term Landscape Changes in the Northwest Territories
The month of December is when we prepare to change into the new year. December 2021’s App of the Month, Landsat Long-Term Change Detection by the Northwest Territories Centre of Geomatics, reflects this sentiment. Taking advantage of the extensive repository of satellite imagery acquired through the Landsat program, this web experience highlights various types of landscape changes that took place in the NWT from 1985 to 2019.
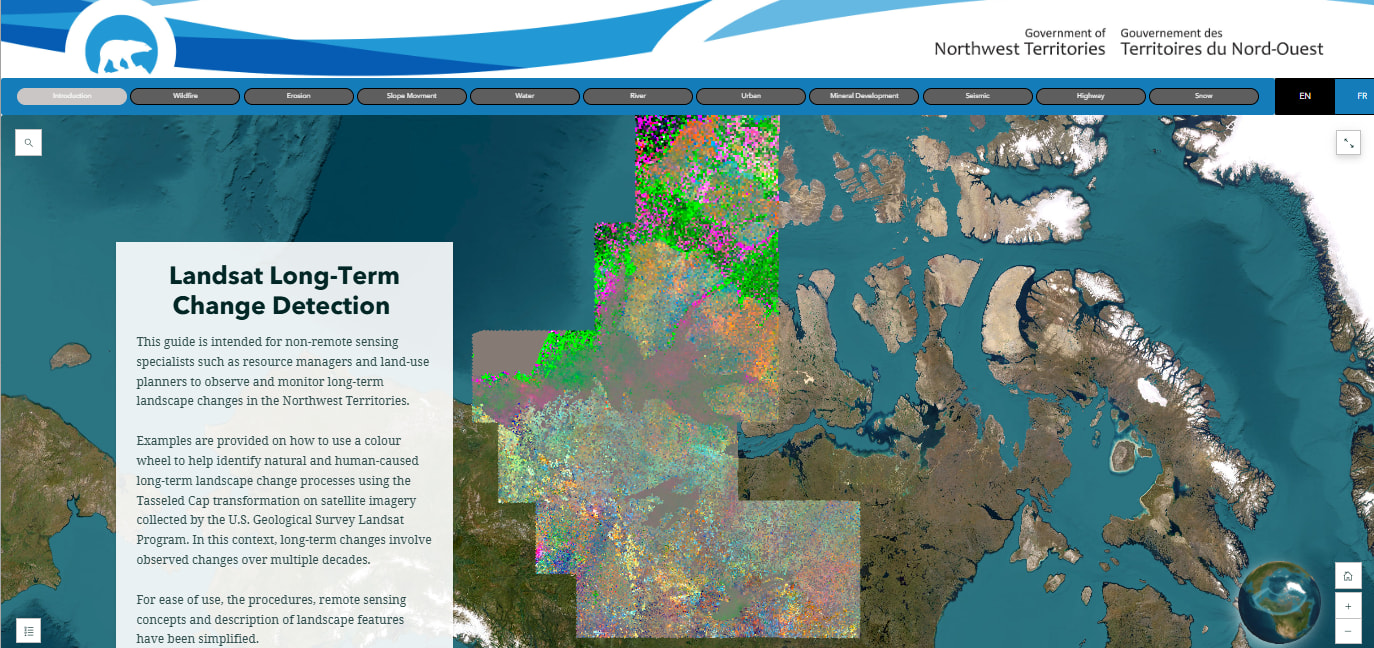
The Landsat satellite program has been collecting imagery of the Earth’s surface since 1972, representing the world’s oldest archive of remote sensing data. The program continues to be successful to this day, as the Landsat 9 satellite launched on September 27, 2021. With over 9 million Landsat scenes available for free, it can be difficult to determine where to start an imagery analysis. Luckily, the Northwest Territories (NWT) Centre of Geomatics has already done all the hard work for us. Their app, Landsat Long-Term Change Detection, provides a user-friendly explanation of the scientific methods they used to identify landscape changes in the NWT from 1985 to 2019 and presents the results in an interactive web experience open to everyone.
Behind the science
The remote sensing team at the NWT Centre of Geomatics analyzed Landsat imagery collected from 1985 to 2019 using a type of remote sensing analysis called Tasseled Cap analysis. The result of the analysis is one raster image that represents the Tasseled Cap trends of changing brightness, greenness and wetness. These Tasseled Cap trends are symbolized to identify long-term landscape change. As someone who is not a remote sensing expert, I got a lot out of the simplified description of the image generation process available in the app’s Introduction tab.
To help visualize the landscape changes, the Tasseled Cap trends of changing brightness, greenness and wetness are symbolized using red, green and blue respectively. In the resultant raster image, areas that are red represent landscapes that have become bare of soil or have been covered in rock, concrete or asphalt. Green areas are indicative of vegetation growth and blue areas represent high-moisture soil or water bodies. However, these colours often mix to represent two different Tasseled Cap trends or all three Tasseled Cap trends at once. The figures and written explanation provided in the app’s Introduction tab help users make the connection between the results of the analysis and what’s visible in the web map.
According to John Burton, manager of enterprise geospatial systems at the NWT Centre of Geomatics, the purpose of this app is “to explain the science behind the image service and to provide some ground examples of where the colours have been verified”. Landsat imagery is available for the entire territory, but the team decided to focus on specific locations where high-resolution images could be used to verify the landscape change. Both anthropogenic and nature-driven changes are showcased to meet the needs of various clients. These include construction of seismic lines, mining, urban development, highway construction, wildfires, slope movements like permafrost thaw slump, shoreline erosion, changing water levels, braided river systems and glacier retreat.
An imagery experience
Built using ArcGIS StoryMaps and ArcGIS Experience Builder, the use of tabs to present all the different types of landscape changes allows users to easily navigate through a large amount of information. Instead of placing everything on one page, users can quickly switch between tabs and scroll through a specific type of landscape change without being overwhelmed by example after example. Once you scroll to the next example in the left panel, the web map extent on the right automatically changes, providing an effortless transition between locations.
While satellite imagery is static, the app’s interactivity encourages a user to explore the images further. Users can enlarge images and time-lapses to get a focused view. Additionally, in the web map, users can turn layers on or off, pan, zoom, return to the original extent, change the basemap and search for an address. The instructions on how to use the web app are helpful for a wider audience who may not be familiar with using ArcGIS StoryMaps or ArcGIS Experience Builder. Bonus: the entire web experience is available in French.
My favourite part of this web experience is the time-lapse included with each example. Time-lapses are an effective way to pinpoint when the landscape has undergone a drastic change. Thanks to the examples of mining, urban development and highway construction provided within the app, we can observe how humans have interacted with and irreversibly changed the landscape of the NWT. In the example below, we can see that the increase in red areas is indicative of the Ekati Diamond Mine increasing in size over time with intensified construction starting in 1993.
Collaboration is key
John Burton wants everyone to know that this project was a team effort. “Many people at the Northwest Territories Centre for Geomatics and Caslys Consulting deserve recognition for its completion. From the NWTCG: Jenny Tjhin, Steve Schwarz, Jurjen van der Sluijs, Kyle Little and Jiaao Guo; from Caslys Consulting: Jas Fajeau, Anthony Warren and Justin McPherson,” he notes.
ArcGIS StoryMaps and ArcGIS Experience Builder are excellent tools for facilitating collaboration between team members, as anyone can edit via browser without needing to install additional software.
The steps taken by the remote sensing team to analyze existing Landsat imagery, publish an image service to ArcGIS Online and then create a public-facing web experience can be used by other groups and organizations looking to increase transparency of the scientific process.
“The app has just been released, but it has started other discussions with our clients on the tools we can use to release their data or how we can put many datasets together to tell a story or to prove or disprove environmental hypotheses,” says John Burton.

Explore the Landsat Long-Term Change Detection web experience for yourself.
Learn more about the NWT Centre for Geomatics.
Want to learn more about Esri’s next generation of web mapping applications? Check out our webinar on ArcGIS Instant Apps.
This post was translated to French and can be viewed here.