Navigating Climate Whiplash: Essential Canadian Flood and Drought Resources
Want to better understand drought and flooding events in Canada? We’ve curated data sources—all available in the ArcGIS Living Atlas of the World—that you can use for your research and to build GIS information products.
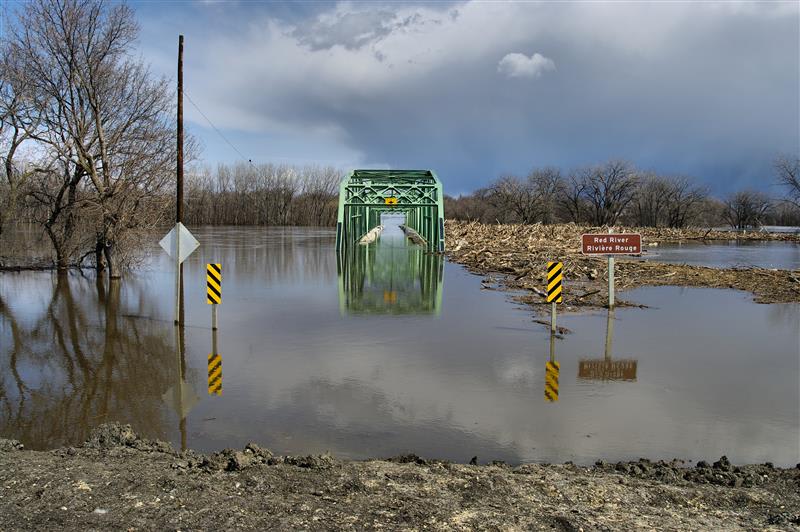
In the last decade, Canada has experienced an increasing number of climate whiplash events. The term climate whiplash is used to describe a quick change between extreme weather events. In Canada, this can be seen in extreme swings from drought to flooding – some of the most frequent, expensive and catastrophic events that the country endures. According to the Government of Canada, flooding causes over $2 billion in damage across the country annually. As extreme weather events become more frequent, it is more important than ever to pay attention to the factors that are increasing the risk of flooding in Canada.
This page has been curated with authoritative national and provincial data that is available in the ArcGIS Living Atlas of the World to make this information easily accessible for you. The Living Atlas is the foremost collection of geographic information from around the world. For more information about the Living Atlas and how you can nominate your own items to be added, read to the end of this blog post.
You can also learn more about climate change data and resources and how Canadians are using GIS to mitigate climate change by visiting climate.esri.ca.
Update frequency: Every 1 hour
This resource contains near-real-time measurements of the amount of water flowing in streams and rivers, provided by the Meteorological Service of Canada. This data is critical to the management of water resources, flooding, fisheries management and more.
2. Canadian and U.S. Drought Monitor Map
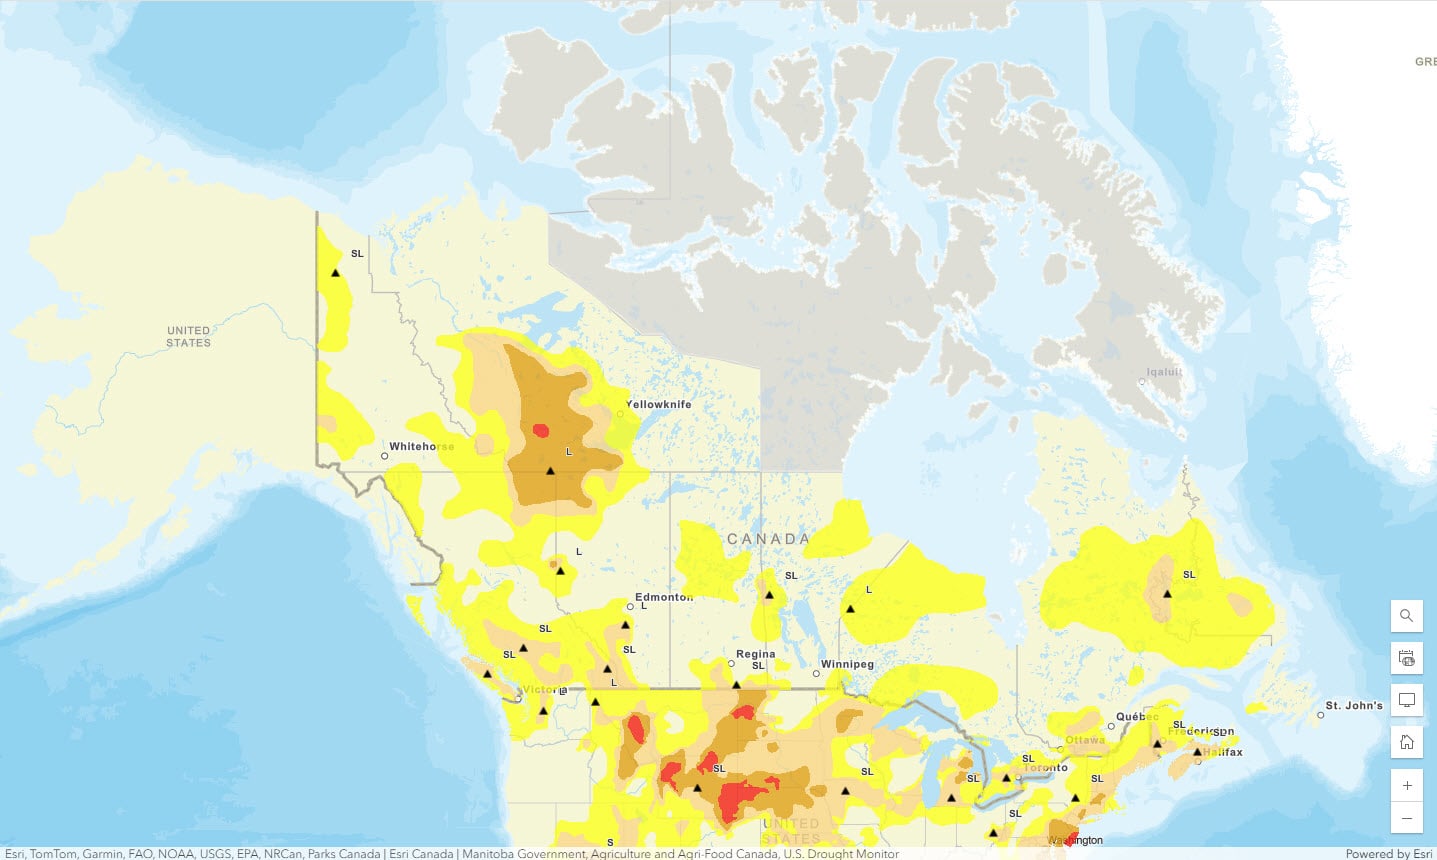
Update frequency: Usually on the 10th of every month
Published by the Government of Manitoba, this web map shows areas of drought. The Canadian areas of drought captured in the map are reported by Agriculture and Agri-food Canada. Drought-prone regions are analyzed based on precipitation, temperature, drought model index and other climate data.
3. National Hydro Network of Canada
Update frequency: When data becomes available
This map provides geospatial data for Canadian inland surface waters, including lakes, reservoirs, river streams, canals, islands, drainage networks, surface water-related construction and obstacles, and more. The map uses the best federal and provincial data from the Government of Canada at a scale of 1:50,000 or better for easy navigation.
Update frequency: Every month
This layer uses the Palmer Drought Index to represent dryness based on recent precipitation, temperature and soil moisture. This index is most effective in determining long-term drought over several months, but is not as good with short-term conditions.
5. Historic Flood Events in Canada

Update frequency: When data becomes available
A publicly available data layer of over 1400 historic flood events in Canada that have been collected and standardized by Natural Resources Canada and sourced from Canadian publications. This layer provides the date and location of floods in Canada between 1696–2022.
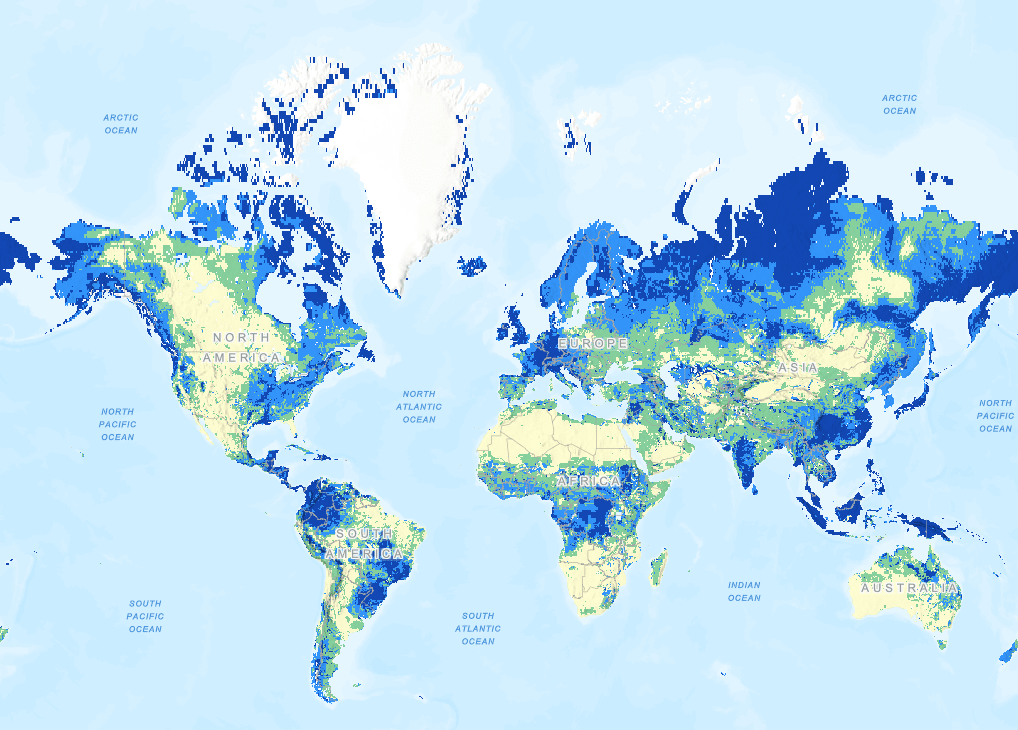
Update frequency: Every month
Track the changes in freshwater availability globally through soil moisture, precipitation, runoff and more. This dataset provided by NASA through the Global Land Data Assimilation System includes climate records from January 2000 to present.
In addition to the national flood data resources provided above, here are a few other web apps containing provincial and local flood information. These applications have been created by local authorities and can be found on ArcGIS Online.
- BC Flood Study Explorer
- Alberta Flood Awareness Map
- New Brunswick River Watch
- Maritime Coastal Flood Risk
- Manitoba Drought Monitor
- Toronto Region Flood Plains
- Newfoundland Flood Risk Map
- Yukon Flood Atlas
The Living Atlas includes content from Esri, Esri partners and the GIS user community. It is easily accessible as it is built into the ArcGIS platform, and a valuable resource when looking for data, imagery, ready-to-use web maps and inspiration for your next web application or dashboard. Esri Canada has a dedicated team that produces and curates the Canadian content found in the Living Atlas, from live feed services tracking Canadian wildfires and weather alerts to national environmental datasets you can easily pull into your work.
If you wish to contribute your content to the Living Atlas, you can nominate your item here.
For more climate change information, check out the rest of our blog post series, whether you’re looking for GIS resources to help better understand wildfires, or the latest GIS resources on climate change as a broader phenomenon.