Spark Learning with ArcGIS: Spring Edition
Spark Learning with ArcGIS is a new blog series that offers fresh ideas to help you explore GIS in exciting new ways each season. Geared towards K-12 educators looking to bring mapping fun into their teaching and engage students in their learning!
With Spring officially upon us, this first post will highlight the possibilities of the season with ArcGIS activity ideas, and interesting maps and apps. From tracking wildlife to identifying blooming flowers and trees, we’ll explore how ArcGIS can bring the beauty of spring to life and inspire your GIS projects.
This blog series will include three sections for every season:
- Activity Ideas – Get inspired to try something new with your students
- Mapping Corner – Tips and tricks and mapping ideas to try
- Maps, Apps and More! – Discover cool content to integrate into your teaching
Spring Activity Ideas
Spring/March Break Adventures - Craft a StoryMap showcasing your Spring or March Break adventures. Use maps and interactive features to tell the story of your favorite moments away or during your staycation.
Tutorials: Discover StoryMaps, Take StoryMaps to the Next Level

Spring is a season of growth, renewal, and endless possibilities for learning and discovery. Image from Canva: Spring Hiking by borchee.
Adventures in data collection and collaboration using ArcGIS Survey123 – educators you can set up one of the following activities for your class this Spring or come up with your own idea:
- Earth Day cleanup – students will collect data on litter types they come across while cleaning their community or schoolyard after the winter melt.
- Spring Bloom – students will collaborate and share the changes in their community by collecting data on the budding of trees, blooming flowers, appearances of crocuses and any other Spring happenings they notice. Add an image question in the survey so the students can share the Spring changes with others.
- Wildlife Sightings – students will collect data on appearances of wildlife in their community. Don’t forget to include images in the survey.
Resources: ArcGIS Survey123 in Action, Survey123 tutorial
Mapping corner
Create charts in ArcGIS Online
A chart is a visual display of data, used to show relationships, trends, or comparisons in an easy-to-understand format. Common types include bar charts, line graphs, and pie charts. Learn how you can configure your own charts in the ArcGIS Online Map Viewer.
Tutorial: Map and Chart Data
Maps, apps and more!
Spring exploration is a great way for K-12 teachers to engage students with maps, apps, and hands-on content. Teachers can use the Trans Canada Trail map to explore geography, while cherry blossom apps allow students to track and learn about nature in real-time. These tools help students connect with the outdoors, while developing skills in data and map literacy. It’s an exciting way to spark curiosity and integrate technology into learning.
Maps
The Geography of the Trans Canada Trail (Web Map)
The Trans Canada Trail spans a variety of landforms, including lush forests, expansive prairies, rugged mountains, and coastal landscapes. Using this web map, you can explore the geographic diversity of Canada by exploring the layers in the Content section that include physiographic regions/landforms, watersheds, climate, national parks and ecology.
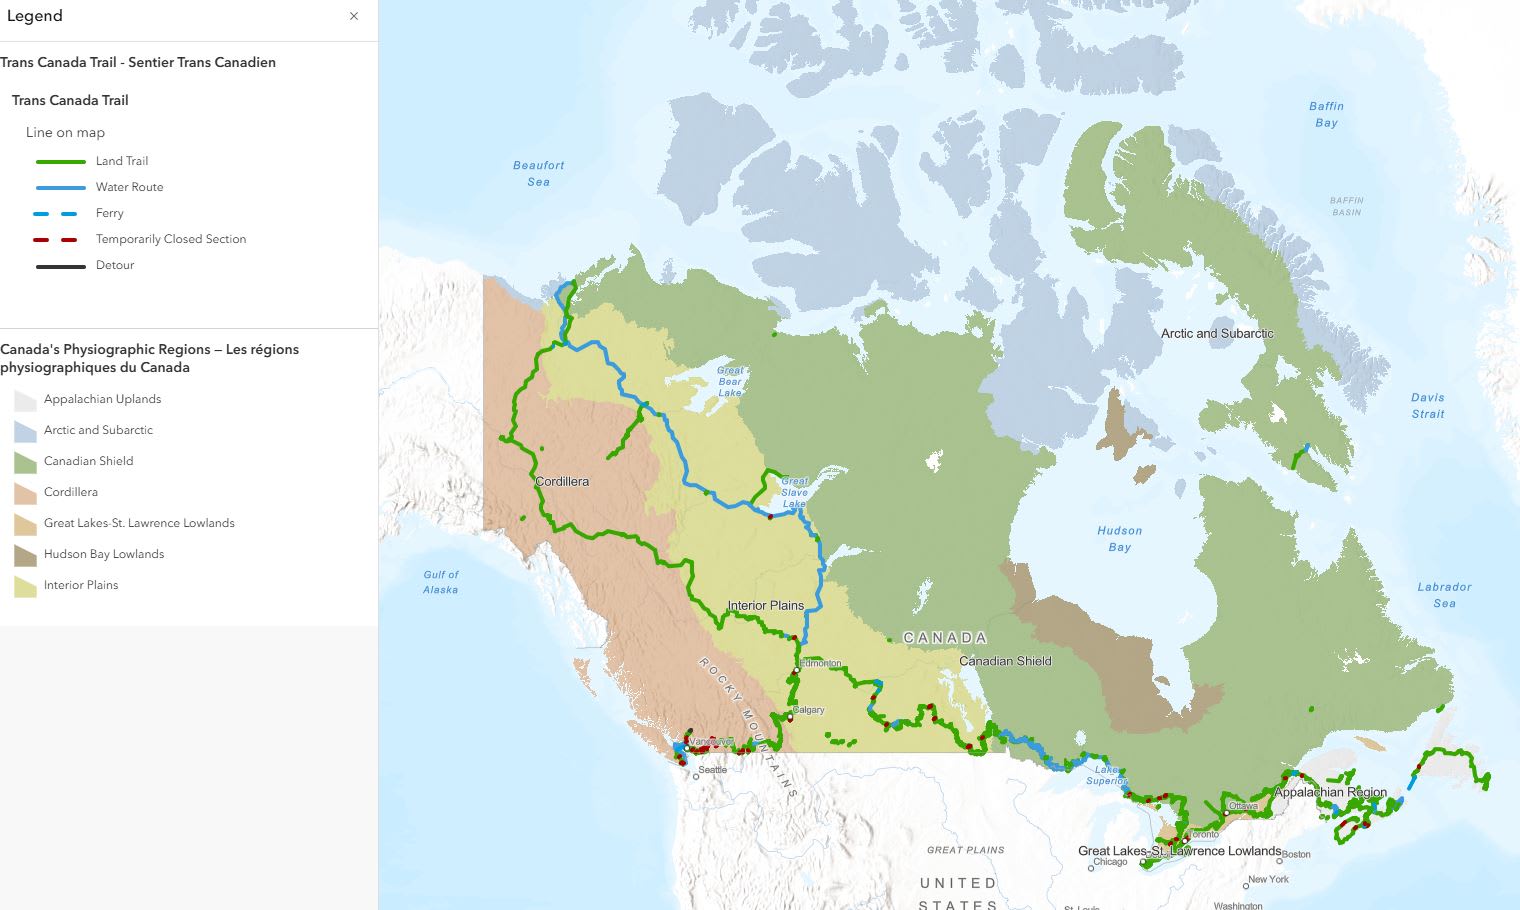
The Geography of the Trans Canada Trail web map is an excellent tool for exploring Canada's diverse landforms and highlights the possibilities to connect with nature through activities like walking or hiking.
Apps
The Beauty in the Natural World, Canadian Geographic Education (StoryMap activity)
Indigenous worldviews see arts, culture, wildlife, plants, and land as interconnected. However, practices and cultures vary among Indigenous communities in Canada, with distinct ways of relating to and celebrating the environment through art.
iNaturalist Web Map Explorer (Beta)
This ArcGIS app lets you explore species observations shared by iNaturalist users globally. Interact with the chart and search for observations in your area. Click on a feature to learn about the observations collected.
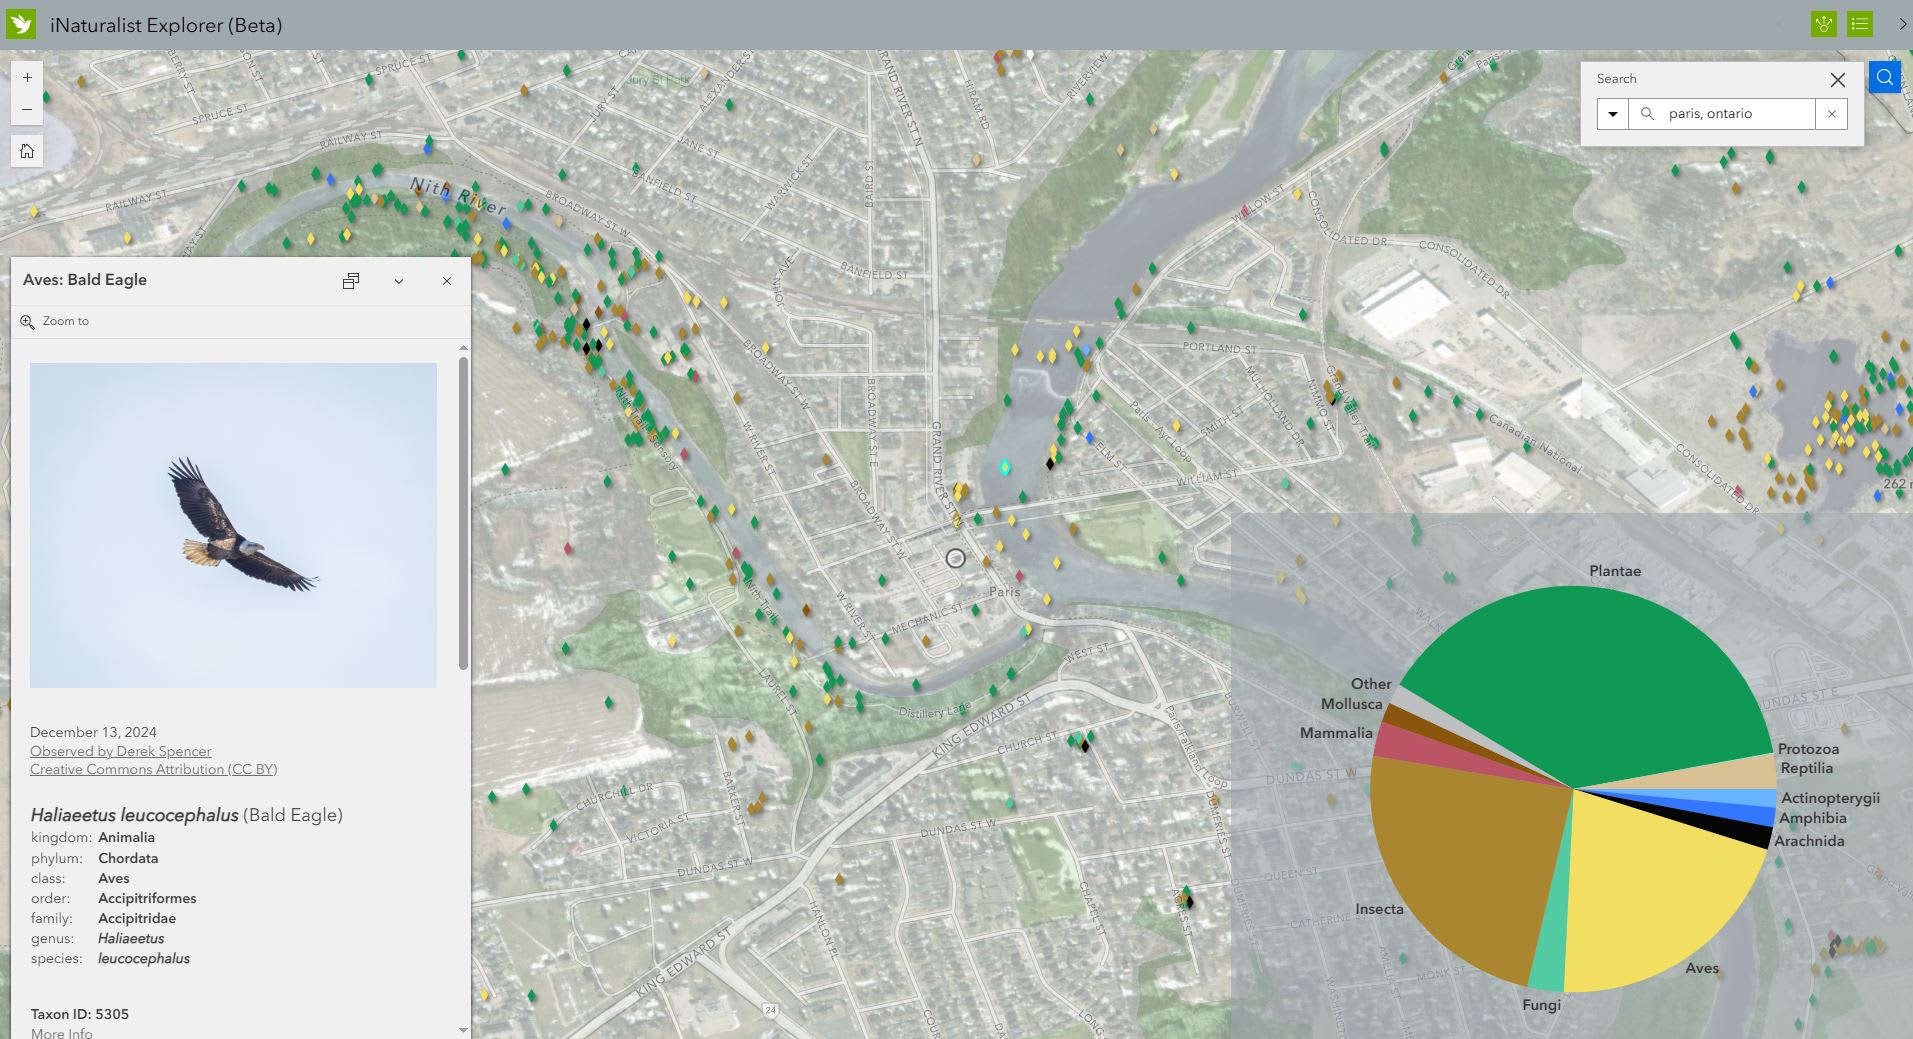
The iNaturalist Web Map Explorer (Beta) offers an interactive way to explore the flora and fauna collected, providing a deeper understanding of the diversity in a region.
Spring is in bloom
Cherry blossoms are cherished worldwide for their fleeting beauty, reminding us to cherish life's little moments. Their spring bloom symbolizes new beginnings and unites people in celebration. Explore the following apps to see where the cherry and other blossoms are located.
Victoria Blooms
Check out this app to see how Spring in Victoria fills the city with these blooms from mid-February to May.
Discover Cherry Blossoms across Europe
See where Cherry Blossoms are located in cities across Europe.
Summer Edition
Stay tuned for next season’s Spark Learning with ArcGIS ideas to inspire your Summer GIS adventures!