ArcGIS Knowledge and the graph store will give you so much more
Discover the power of ArcGIS Knowledge to model truly connected real-world systems. It’s like having a fussy spreadsheet, a versatile mapmaker and a wise geographer all rolled into one mighty tool.
ArcGIS Knowledge is transforming how organizations understand and discover complex relationships within their data. As an optional capability for ArcGIS Enterprise, ArcGIS Knowledge provides an effective and flexible way to add enterprise knowledge graph software to your existing ArcGIS investment without adding new vendor technology. ArcGIS Knowledge is accessed via ArcGIS Pro or ArcGIS AllSource to integrate the strengths of graph databases and GIS to model real-world systems and visualize and analyze connections. Check out the wide variety of areas that ArcGIS Knowledge can help you better understand (especially check out the video links), including health and disease, infrastructure networks, supply chain management, wildlife habitats and more.
How can your organization use ArcGIS Knowledge to perform advanced data investigations using flexible and spatial knowledge graphs? The answer is in three steps:
(1) On top of your ArcGIS Enterprise base deployment, deploy and federate an ArcGIS Knowledge Server site, which involves an ArcGIS Knowledge Server role, and an ArcGIS Data Store configured as a graph store.
(2) Sign in to ArcGIS Pro using credentials in the active ArcGIS Enterprise portal that include privileges to create content and knowledge graphs.
(3) Use the tools in ArcGIS Pro to create and manage knowledge graphs in your new graph data store by defining entity types and relationships and loading in the data that is probably already in your deployment’s data store.
Whoa! Let’s stay out of all the technical jargon of server software installation (leaving that in the capable hands of your talented IT folks) and define a few key terms—like databases and graphs—so you will have a better idea of why you want to leverage the capabilities of ArGIS Knowledge.
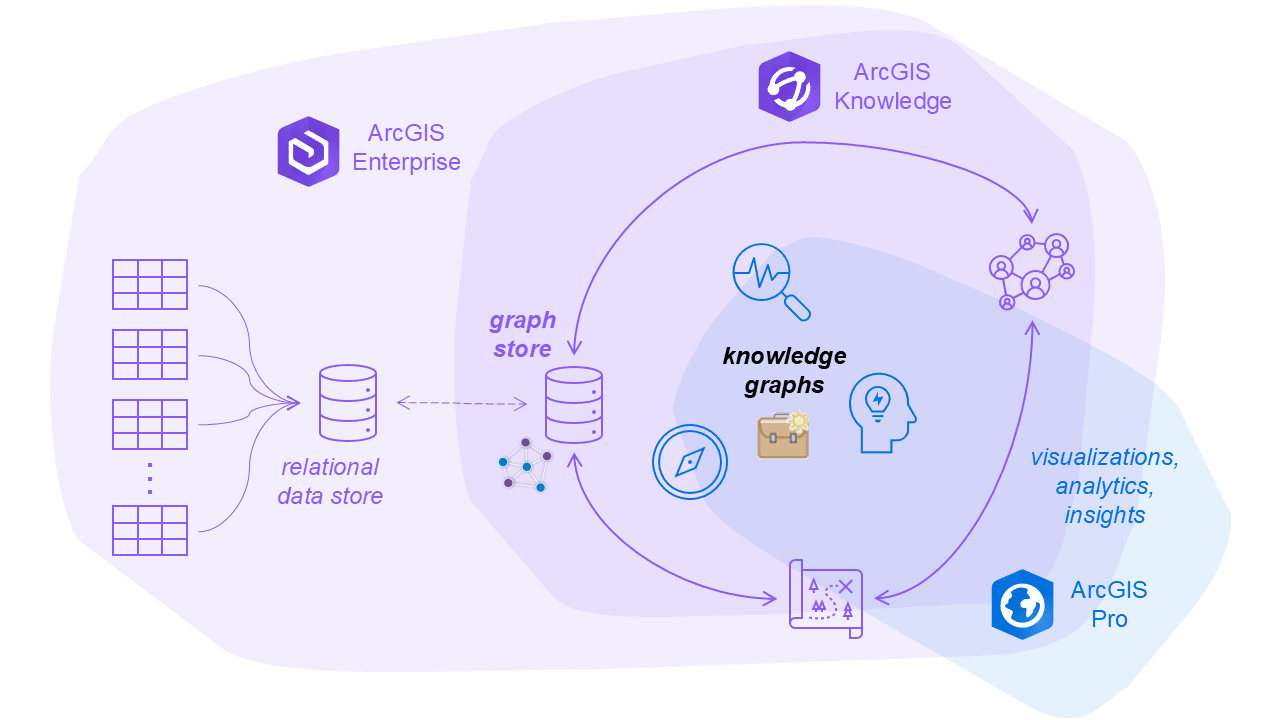
The main components of ArcGIS Knowledge: the optional relational database (“fussy spreadsheet”), the graph database (“versatile mapmaker”) and the knowledge graph (“wise geographer”) all co-exist within the ArcGIS system, which consists of ArcGIS Enterprise, the ArcGIS Knowledge server role with a graph store and ArcGIS Pro desktop software. Together they help you manage and analyze your data using knowledge graphs that represent complex relationships between data entities.
Relating tabular data: the fussy spreadsheet
ArcGIS Enterprise uses enterprise geodatabases, which are built on top of standard relational databases like IBM Db2, Microsoft SQL Server, Oracle, PostgreSQL and SAP HANA. Note: a relational data store is optional if you are setting up ArcGIS Enterprise for the first time solely for a graph store.
A relational database is like a fussy spreadsheet because it insists on everything being perfectly organized and structured with neatly arranged rows and columns stored in multiple tables with strict rules about how data is related and connected. It requires you to define relationships between tables using keys (much like how a meticulous spreadsheet user would use formulas and references to maintain order). It is fussy for very good reasons, because it ensures data integrity and consistency allowing for the use of the universally known structured query language (SQL), but it can also make adding new types of data or relationships a bit of a chore (and too many join operations can get quite taxing for you and your system). Most of your data is most likely already in your relational data store, so you can conveniently load what you want from there into your knowledge graphs.
Graphing your data: the versatile mapmaker and the wise geographer
With an ArcGIS Knowledge configuration, ArcGIS Pro provides you with the tools to create and manage knowledge graphs. You can load in all the tabular data from any source (including unstructured and structured, from inside your relational data or external files) and define the entity types and relationships in your graph store. Keep in mind that the data in your graph store are no longer connected to the original source; therefore, any changes made to your source data will need to be made to your very flexible graphs. While both the graph database and knowledge graph use entities and relationships (a.k.a. nodes and edges in graph theory) to represent and connect data, a graph database focuses on efficiently storing and querying these connections. It's great for finding relationships and patterns quickly. A knowledge graph, on the other hand, builds on this by adding semantic context, making it possible to infer new information and gain deeper insights.
A graph database is like a versatile mapmaker because it excels at understanding and visualizing connections including non-spatial ones (consider mind mapping or data model mapping!). Just like a mapmaker/cartographer who creates detailed maps showing how different places are linked by roads and rivers, a graph database maps out all kinds of relationships between data points. It uses entities (like factories or people) and relationships (like routes or family status) to represent and connect all the various pieces of information. This makes it super easy to see how everything is related, whether you're representing supply chains or social networks. So, just as a mapmaker helps you navigate the physical world, a graph database helps you navigate complex data relationships with ease and clarity, albeit using the lesser-known graph query language (GQL).
A knowledge graph is like a wise geographer because it not only maps out the connections but also understands the deeper context and meaning behind them. Just as a geographer knows the history, culture and significance of different places, a knowledge graph enriches data with semantic information (ontologies) to provide deeper insights. It doesn't just show that two things are connected; it explains how and why they are connected, offering a richer, more nuanced understanding of the data.
ArcGIS Knowledge gives you the ability to create and work with knowledge graphs in ArcGIS Pro, the details of which are for another conversation, but include:
- The ability to analyze spatial entities
- The ability to query the contents of a knowledge graph
- The ability to analyze and explore a knowledge graph using a link chart
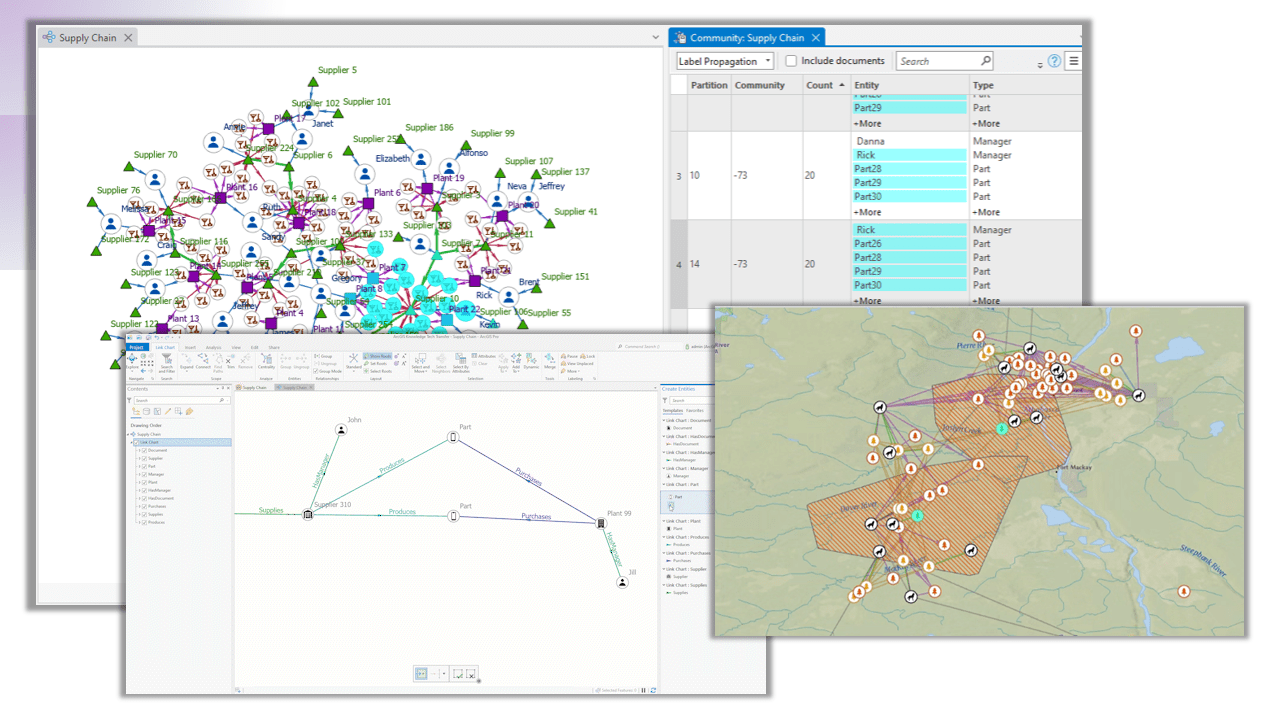
ArcGIS Knowledge enables you to use ArcGIS Pro to spatially and non-spatially visualize and analyze data as entities and their relationships.
Connecting the dots
Like anything in ArcGIS, you don’t have to choose only one way when you can have more. ArcGIS gives you the spreadsheet-like organizer of all the tabular data (relational database) + the practical map made of data connections (graph database) + the insightful geographic perspective on the significance of the entities and relationships (knowledge graph). Of course, you can integrate data from anywhere, but if you have already invested in your ArcGIS Enterprise relational data store, it’s a logical starting point. While relational databases have been the trusty data store for years, graph databases are stepping into the spotlight because they offer significant advantages in flexibility, performance and intuitive data modelling of complex relationships and large datasets. By integrating graph databases with tools like ArcGIS Knowledge, you can unlock more insights and drive better decision-making.
Discover the power of ArcGIS Knowledge to model truly connected real-world systems by learning more through the product documentation: ArcGIS Enterprise Knowledge Graph Software & Analytics, Essential ArcGIS Knowledge vocabulary in ArcGIS Enterprise and Essential ArcGIS Knowledge vocabulary in ArcGIS Pro.
If you already have ArcGIS Knowledge, you can connect with the self-paced e-Learning: ArcGIS Knowledge Fundamentals Learning Plan. You can even try before you buy and/or get even more empowered with Esri Canada’s instructor-led training: Graph Analytics Using ArcGIS Knowledge.
P.S.: Here are a few jokes to make you think even more about all this:
- Why did the spreadsheet, mapmaker and geographer go on a road trip together?
- The spreadsheet wanted to keep track of expenses, the mapmaker wanted to plot the course and the geographer wanted to explore new territories!
- How did the mapmaker, spreadsheet and geographer solve the mystery?
- The mapmaker calculated the location, the spreadsheet listed the clues and the geographer provided the context!
- Why did the geographer invite the mapmaker and spreadsheet to her birthday?
- Because she knew they would help her plot the best celebration and keep everything in order!
Want to stay informed about all the latest training opportunities at Esri Canada? Visit Esri Canada’s Communication Preference Centre and select the “Training” checkbox to get a monthly roundup straight to your inbox.