Tackling Emerging Planning Challenges with ArcGIS Urban
Planners across Canada are faced with a myriad of dynamic, rapidly evolving new pressures. In the face of housing shortages, climate change and population growth, planners must be able to quickly formulate and respond to policy changes. ArcGIS Urban can be a powerful tool in the modern planner’s arsenal, allowing for creation of precise models of potential growth and change across key neighbourhoods. This blog demonstrates how planners might leverage ArcGIS Urban to quickly understand the potential growth of a key transit hub and share their results with key stakeholders.
Introduction
Cities across Canada are facing unprecedented planning challenges in the form of new environmental pressures, changing demographics and perhaps most significantly, an ongoing housing crisis. Today, planners are hard at work drafting new planning policies to build cities that are more affordable, equitable and resilient than ever before. However, effective policy making is only possible when we have a complete understanding of the potential for growth within a city. ArcGIS Urban empowers planners to understand opportunities for change within neighbourhoods and to explore how proposed planning changes can unlock growth potential across multiple scenarios.
Like many municipalities in Ontario, the City of Hamilton is currently exploring the new planning frameworks of Protected Major Transit Station Areas (PMTSA) and Inclusionary Zoning to encourage new affordable housing development around key transit hubs. This article showcases how ArcGIS Urban allows for a parcel-by-parcel re-imagining of Hamilton’s downtown core as a Protected Major Transit Station Area and how that change might be leveraged to result in new affordable residential developments.
Please note that the work presented below is intended for demonstration purposes only and is not intended to represent current planning initiatives by the City of Hamilton.
Step 1: Identify sites for new development
As part of the designation of key transit hubs as Protected Major Transit Station Areas, the Province of Ontario requires municipalities to identify expected density targets, in terms of population and jobs per hectare. But how can we realistically model the growth potential of a proposed PMTSA area?
As a first step, we can use ArcGIS Urban’s Parcel Suitability analysis tool to identify the locations which are most likely to see redevelopment. Using this suitability analysis, we can define a custom set of criteria to help identify parcels likely to see re-development.
Once our criteria are set, ArcGIS Urban automatically generates a suitability score for every parcel within our study area, allowing us to highlight only those that match all conditions, as demonstrated in the video below.
Step 2: Understand the constraints on future development
After determining where development is likely to occur, we need to understand what kind of development is possible in these areas. ArcGIS Urban understands regulations from the zoning bylaw, allowing us to model the precise buildable area on each lot via the maximum coverage, building height and required setbacks. Our model also understands exactly what kinds of development are permitted or prohibited within different zones.
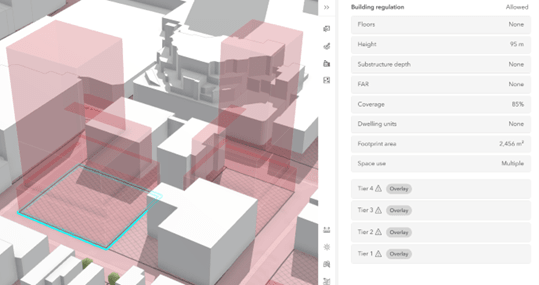
ArcGIS Urban displays the precise buildable area of each parcel as a transparent envelope
Developments in downtown Hamilton are further controlled through the Downtown Hamilton Secondary Plan, which specifies additional restrictions block-by-block within the Downtown area. ArcGIS Urban supports representation of these special constraints through the use of Overlays, which allow us to apply special rules that will supersede underlying zoning where required.
With our building regulations in place, we can now quickly apply a series of buildings within these constraints using Building Types: customizable templates of common building forms. When applied, buildings are generated which are automatically matched to the applicable Zoning and Overlay regulations for a given parcel.

Quickly apply customizable Building Type templates to parcels across the study area
Step 3: Refine visualizations of possible buildings
At this stage, our buildings are looking great. However, we should fine-tune them further to improve our visualization and ensure we are considering all development regulations and best practices.
The City of Hamilton has published a “Tall Building Guidelines” document, intended to guide developers and architects in proposing buildings that align with the City’s vision for the evolving character of the downtown core. These guidelines include recommendations regarding building articulation, tower-podium relationships and streetscape design. Using ArcGIS Urban’s advanced space editing tools, we can adjust our buildings to meet these specific, fine-grain expectations.

Apply precise edits to building form with space editing tools
Step 4: Evaluate the impact through key metrics
Now we have our buildings in place, with realistic massing that respects regulations and design best practices. But what do these buildings mean for our study area? How can we understand their impact on key statistics, such as the all-important population and job density value, required by the province when designating this area as a PMTSA?
This is where the concept of Custom Metrics in ArcGIS Urban comes into play. Custom Metrics allow us to define a set of calculations that operate off of the total area of different uses in our buildings to generate values such as the number of household units, jobs and more.
Using metrics, we can calculate key statistics such as population density and an estimation of the number of affordable housing units that might be generated via Inclusionary Zoning practices.
Step 5: Prepare to share the results
As a final step, we will want to share the results of our work with key internal stakeholders and members of the public.
Before providing access to our content, it’s important to think about who our audience is and how they will engage with the ArcGIS Urban scene. Navigating a 3D scene is not always intuitive to users and members of our audience may not have the planning background to understand ArcGIS Urban visualizations intuitively. ArcGIS Urban allows us to set up Viewpoints – bookmarked camera positions that allow non-specialist users to easily navigate the scene.

Preserve and navigate to key camera angles with Viewpoints
And there we have it: a detailed, appealing visualization of the potential growth for our newly proposed PMTSA. What is more, this visualization is tied to key metric calculations, meaning we can be confident in answering those questions defined by the Provincial Government as part of the PMTSA application process.
With our plan finalized, we are now free to export our results to other ArcGIS Online applications, such as ArcGIS Dashboards or ArcGIS Experience Builder, to facilitate community engagement and feedback.

Integrate exported scenes into ArcGIS Dashboards, ArcGIS Experience Builder and more