Upload ArcGIS Survey123 data retrieved from a phone to ArcGIS Online - Part 2
Have you ever run into a situation where you couldn’t access your ArcGIS Survey123 data from your phone or tablet? Don’t panic—you’re not alone, and we’re here to guide you through it. In this blog post we will delve deep into the process of recovering ArcGIS Survey123 data from your phone. To make sure when it happens to you, you know how to recover it.
Introduction-
This blog is Part 2 of a 2-part series on The Ultimate Guide to Recovering ArcGIS Survey123 Data from Your Phone. This second part will cover how to upload the ArcGIS Survey123 data retrieved from a device to ArcGIS Online. If you do not yet have the ArcGIS Survey123 data retrieved from your phone, please refer to the previous blog post here.-
Recovering your ArcGIS Survey123 data as CSV files using Python
If you’ve updated a survey schema but have users who haven’t yet sent in all their entries, they will encounter errors when trying to submit their data. Fortunately, there’s a solution to this issue: you can export your SQL database as CSV files and upload them to ArcGIS Online as a feature layer, either directly or through ArcGIS Pro
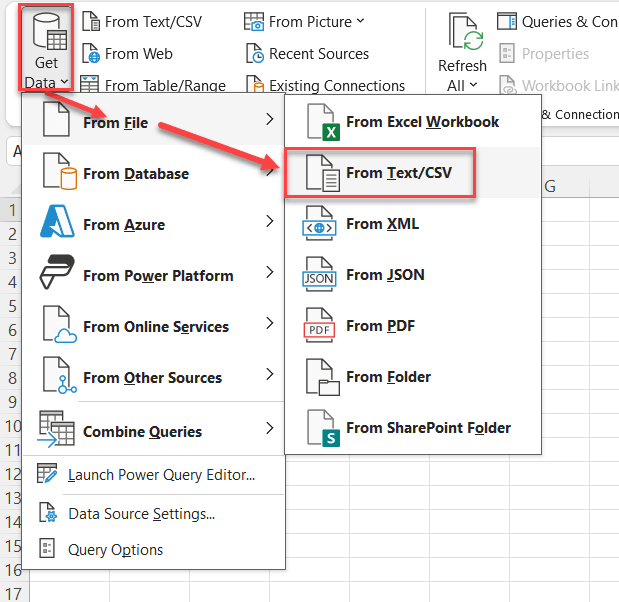
To get started, download this Python script from GitHub and open it in a code editor like Visual Studio Code. If you are using VS Code, make sure to install Python both as an extension in the editor (instruction below) and from the Microsoft Store.
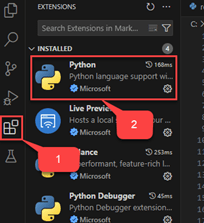
How to download Python on Visual Studio Code
Once you have the Python script open in the editor, be sure to trust the file/folder. We can now start making small adjustments to the script to match your environment. Start by updating the IN_DB variable on line 11 to point to the directory of your SQL database from your phone. Next, set the OUT_DIR variable to the file path where you’d like the CSV files to be saved (example below).
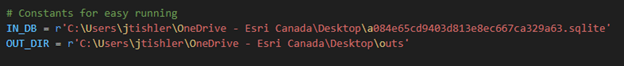
Example code
Scroll down to around line 103. Here, you will see that the code is currently configured to only pull surveys with status codes 1 and 3 – these represent surveys in your outbox or those that have encountered submission errors. If you’d prefer to export all surveys, you can modify line 103 to the following:
This change will include all surveys from your phone. (See image below for the updated code block).

Example code
Once you have updated the code, click ‘Run’ in the top right corner.
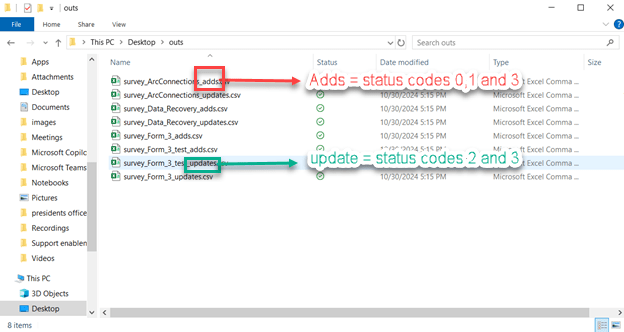
After the script has run, navigate to the directory you specified for the CSV files (Example below). You will find several CSV files, organized by survey status. Files in the ‘Adds’ folder correspond to status codes 0,1, and 3, while those in the ‘Updates’ folder represent status codes 2 and 4. (Note: Repeats will also be exported as a separate CSV file Showing a parent global ID to Identify which records they pertain to.)
Recovering your data to ArcGIS Online as-is
Now that your data has been converted, head over to ArcGIS Online and ‘Add a New Item.
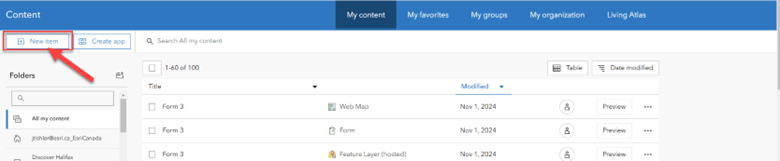
Next, drag the CSV file containing the survey entries you want to upload. Choose to add it as a hosted feature layer and use the X and Y geometry fields to map the points. Once done, save the file with your preferred name. Your entries will now be successfully restored to ArcGIS Online (see demonstration below).

Using CSV files with ArcGIS Pro to fully recover the survey data
What if you have a complex survey with attachments and/or polygons?
Don’t worry! It is still possible to recover everything using ArcGIS Pro. In the next 2 sections, we will discuss how to use the recovered Excel sheets to retrieve points with attachments, as well as polygons or lines.
Recovering Points and Attachments
With this workflow, you can easily recover attachments and spatial point data from your phone’s surveys. For this to work, you will need:
- The converted CSV files you retrieved from the Python script and
- The folder survey attachments you extracted from your phone.
First, you will need to edit the CSV file in Microsoft Excel:
- Remove empty rows. You can filter for blank rows and delete them. (Here's a step-by-step guide on how to do this.)
- Convert epoch time to date-time format. Use the following Excel formula to convert the epoch value into a readable date and time:
=TEXT((EPOCH/1000 + ("1/1/1970"-"1/1/1900"+1)*86400) / 86400,"DD/MM/YYYY HH:MM:SS")
- Ensure photo filenames are listed under the picture field. If there are images attached to the records, make sure the filenames are correctly listed under the picture field. This is crucial for attaching the images to the corresponding points in your new feature layer. (For more on this, refer to the “Create a replicate survey from an SQLite database in ArcGIS Pro" section).
- Rename and save. Save the workbook as a CSV file in the same folder as your attachments.
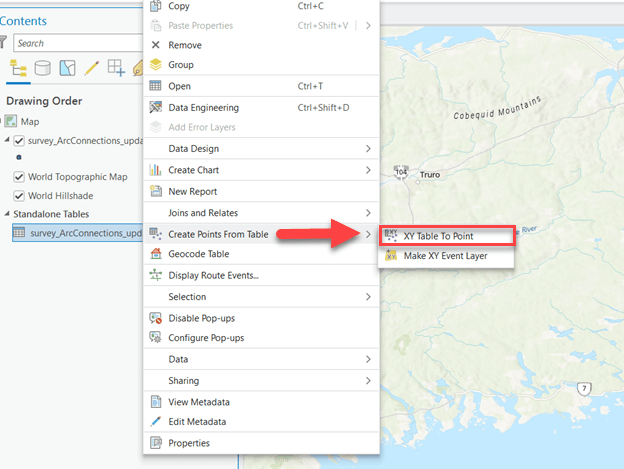
Now, upload the CSV file to ArcGIS Online and add it to your ArcGIS Pro project. Once it is added, right-click the table and select Create Points from Table > XY Table to Point.
Now you can display your data by choosing X field as x_geometry and Y field as y_geometry.
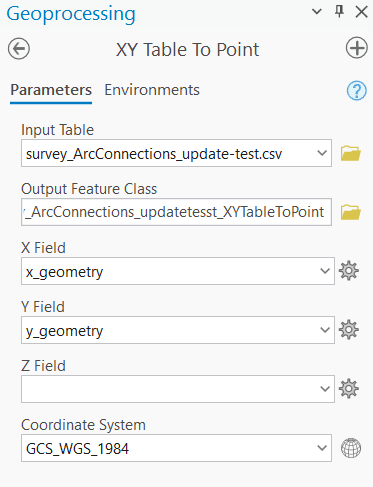
Example tool
To recover your attachments, use the Enable Attachments tool with your new point layer.
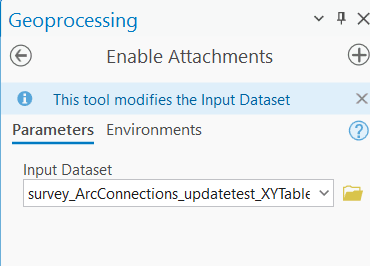
Example tool
Next, use the Add Attachments tool to associate the correct attachments to your points. For this, set both the Input Dataset and Match Table to the point layer. Then, link the Match Path Field to the picture field, and finally, set the Working Folder to the directory where your CSV file and attachments are stored.
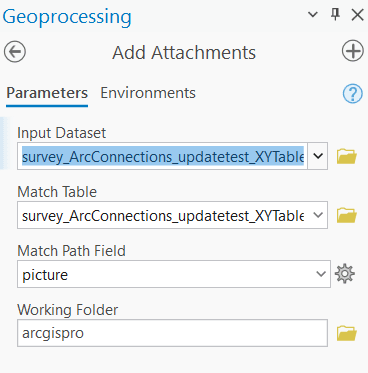
Example tool
The images should now be attached to their corresponding points.
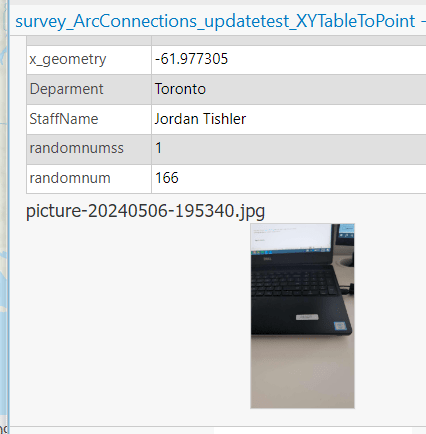
Example entry
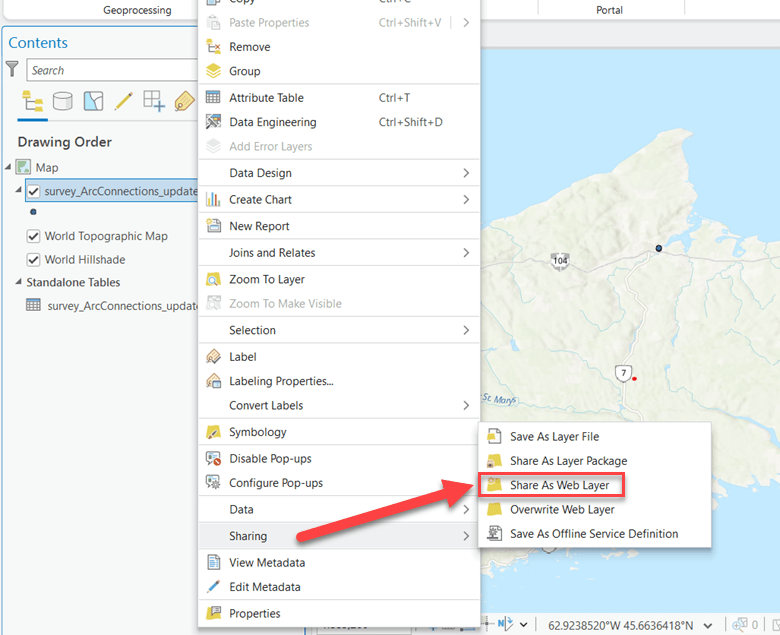
Following a similar process as previous sections, you can upload this data as a feature layer to ArcGIS Online from ArcGIS Pro. Simply right-click on the layer, select Sharing and then choose Share as Web Layer.
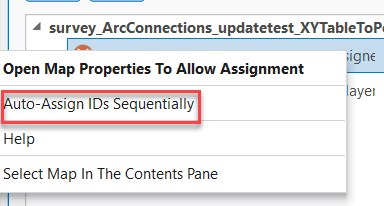
Make sure to Analyze the layer for errors or warnings. If you receive the error “Unique numeric IDs are not assigned”, simply click the three dots on the error and select 'Auto-Assign IDs Sequentially.’ One you’ve cleared the Analyze window, you can safely Publish the layer.
Recovering Lines and Polygons
With this workflow, you can recover polygon or line data from surveys on your phone that were created using GeoShape or GeoTrace questions. To follow this process, you will need the CSV files you converted using Python. (Note: This process can be time-consuming – if you don’t need your polygons, you can skip these steps.)
We will start by editing the Shape field to prepare the data for ArcGIS Pro. In a blank cell next to the last field, use the TEXTSPLIT function to separate the points by commas (example formula: “=TEXTSPLIT(B3,",")”). After splitting, copy all the rows that spill out and paste them into a new row with just the values. Then, copy this data again and paste it into another cell using Transpose to paste it vertically.
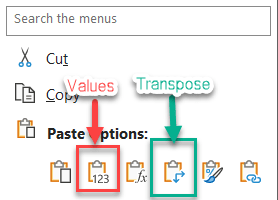
Paste options in Excel
Next, apply TEXTSPLIT again, but this time use a space instead of a comma in a new field (example formula: “=TEXTSPLIT(B3," ")”). Once you’ve split the data, straighten it out by copying and pasting it one last time into a new worksheet with just the values. Insert a new row at the top with six fields labeled: Point_X, Point_Y, Start_X, Start_Y, End_X and End_Y.
You should already have the Point_X and Point_Y. The Start_X might currently be set to Z geometry (which defaults to 0), so copy the Point_X and Point_Y into the Start_X and Start_Y fields, respectively. For End_X and End_Y, copy the next set of points down the list (of Point_X/Y), all the way to the end.
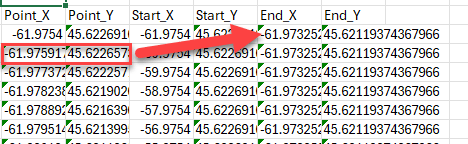
Then, copy the first point’s Start_X and Start_Y as the last point’s End_X and End_Y. Your data should now look something like this:
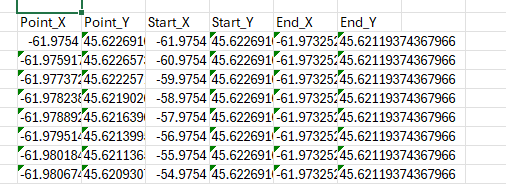
Example result
Save this workbook as a CSV file and import it into ArcGIS Pro. (Note: This process is for one polygon – if you have multiple polygons, you’ll need to repeat the steps above for each one).
Add the CSV to your ArcGIS Pro project and use XY Table to Point to create a point layer.
Example tool
Next, use XY to Line to create the line feature. If you’re only working with lines, you can stop here and proceed to the end of this section.
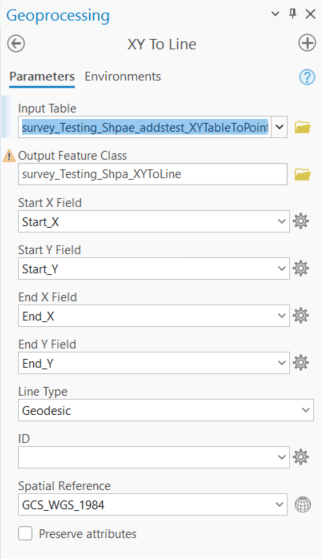
Example tool
Now, use Feature to Polygon to create the polygon.
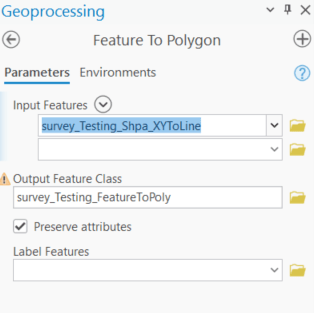
Example tool
Finally, you can upload the feature to ArcGIS Online (as seen in the ‘Recovering Points and Attachments’ section).
Manually recovering your data using an SQL browser
This step should be considered an absolute last resort, as it takes the longest to complete. Only try this method if the previous approaches do not work for you.
To start this workflow, you need to download a database browser like DB browser for SQLite. This will allow you to freely edit the SQL database and actively recover your data.
Once you have downloaded the program of your choice, load the SQL database file from your phone and export it as a CSV.

Once exported, open the file in Microsoft Excel using the Add Data tool. A pop-up window should open – simply select ‘Load.’
You will notice that the data for each record is in the data column.
This data can be parsed out using either the Text to Columns tool in Microsoft Excel or the Text Split equation. After splitting the data, the next step is to clean it up manually and organize it into a format that is easy to read in ArcGIS Online. This involves reconstructing the fields and data.
If the Python script is executed correctly, your data will resemble the example survey shown below. If you are only interested in the locations of the points, you can simply extract the x and y fields. (Note: Please keep in mind that this process can be tedious and should only be undertaken if the previous options fail to yield results).

After you have successfully reconstructed your data, you can re-upload it to ArcGIS Online by following the steps seen in the ‘Recovering your data to ArcGIS Online as-is' section.
Final Thoughts
You now have a way to recover your surveys in case of corruption or deletion. However, to avoid coming back to this blog, make sure to always enable the delete protection feature and back up your survey data frequently.
I hope you can now rest easy knowing there is a way to recover your survey items – even after deletion!
Extra Resources
- GeoSnap: How to Recover ArcGIS Survey 123 Records from a Phone Using Python
- Support article: Create a polygon from an XY data table
- Support article: Create a replicate survey from an SQLite database in ArcGIS Pro